


Chinese Journal of Information Fusion
ISSN: 2998-3371 (Online) | ISSN: 2998-3363 (Print)
Email: [email protected]

In recent years, with the development of deep neural networks, methods based on deep learning have achieved remarkable performance in various visual tasks, and object detection is one of the key problems in computer vision. Due to the limitations of the environment and remote sensing image acquisition technology, remote sensing images often have characteristics such as low resolution and high noise, which are detrimental to the detection of small targets in remote sensing. Among the current mainstream algorithms, small target detection technology based on image super-resolution reconstruction has attracted the attention of many researchers.
Current methods for detecting small targets in low-resolution remote sensing images mainly follow the "reconstruct first, then detect" technical paradigm. Typical methods include attention mechanism models based on single-image reconstruction [1, 2, 3, 4], multimodal spectral fusion frameworks, and cross-scale feature migration networks [5, 6, 7, 8]. However, there are three main limitations in existing methods: First, decoupling the reconstruction process from the detection task leads to a mismatch in feature representation. Super-resolution networks focus on optimizing PSNR metrics while neglecting high-frequency edge features that are crucial for detection. Second, multi-stage architectures cause feature redundancy, as separate reconstruction and detection modules require repeated feature extraction, leading to redundant consumption of system storage space and computational resources. Third, there is insufficient degradation modeling; existing methods often use simple bicubic downsampling to simulate image degradation, failing to fully consider actual physical constraints such as illumination, atmospheric scattering, and sensor noise.
In this paper, We present an EFSOD to address the above issues. Its innovation is reflected in two aspects: First, an edge enhancement module is designed to effectively alleviate the problem of detail loss by introducing abundant high-frequency edge features, thereby improving the accuracy and precision of target detection. Second, a systematic analysis of the intrinsic correlation between super-resolution and target detection models in terms of feature representation is conducted, and a multi-layer feature fusion mechanism is proposed. This mechanism achieves complementary and synergistic optimization of both types of features through cross-modal feature interaction, significantly enhancing detection performance.
Our main contributions can be summarized into three folds:
We introduce the EFSOD. The network effectively enhances the accuracy of small target detection without increasing complexity.
We propose a collaborative architecture of edge enhancement super-resolution reconstruction module and cross-model feature interaction mechanism. The former enhances the edge features of targets through an edge-enhanced dense residual network. The latter addresses the issues of detail loss and feature mismatch by integrating the complementarity and consistency of super-resolution features and target detection features.
We propose a remote sensing image degradation method. This method simulates the impact of lighting and atmospheric conditions on the remote sensing imaging process through Gaussian blurring, adding noise, downsampling, and simulating illumination and atmospheric scattering. This significantly enhances the model's robustness in complex real-world scenarios.
Small object detection is an important task in computer vision. It focuses on identifying target objects that are smaller in size and have a lower pixel proportion in images or videos. Current methods proposed for small object detection mainly include multi-scale representation [9, 10, 11, 12], contextual information [13, 14, 15, 16] , region proposals [17, 18, 19, 20], and image super-resolution methods [21, 22, 23].
In object detection networks based on image super-resolution, the method addresses the issue of small objects covering few pixels by utilizing generative adversarial networks (GAN) [24] to transform low-resolution original images into higher-resolution versions, thereby implementing object detection on these high-definition images. Li et al. [25] proposed a target detection method based on two stages, which realized the framework of automatic detection and search of potential target regions. Krishna et al. [26] proposed a task-driven super-resolution method that combines low-level image processing with high-level visual objectives. Perceptual GAN [27] enhances the representation of small objects to super-resolution representations, providing more substantial discernment capabilities. To obtain more features, Bai et al. [28] introduced image-level super-resolution on candidate boxes for small objects in their SOD-MTGAN. EESRGAN employs ESRGAN [29] in the generator to obtain intermediate super-resolution images (ISR) and uses EEN to enhance edge features, resulting in the final SR images that are inputted into the detection network for detection.
Existing small object detection methods based on super-resolution reconstruction have achieved considerable advancements. However, these methods still have some shortcomings. 1) Most approaches rely on complex super-resolution generators or adversarial networks, leading to high computational costs and difficulty meeting real-time detection requirements. 2) The target features of super-resolution models are easily disrupted in noisy and complex images, which may affect detection accuracy. 3) Most current models employ separate super-resolution and detection networks, failing to utilize the complementary relationship between their features fully. Therefore, this paper considers enhancing edge features and cross-model feature fusion for low-quality remote sensing images to improve the accuracy of small object detection while maintaining the same computational complexity.
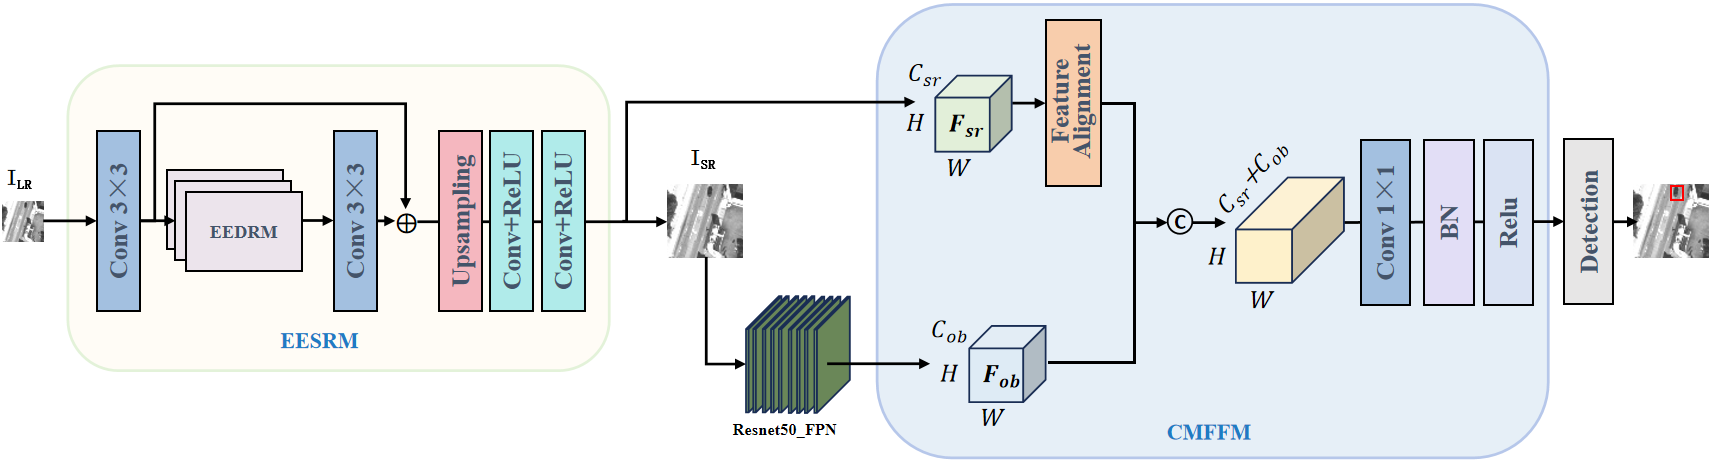
This paper proposes the EFSOD to address the shortcomings of existing small object detection algorithms based on super-resolution reconstruction. The EESRM and the CMFFM improve image quality and enhance target edge features, increasing detection accuracy. EFSOD shares information at the feature level, allowing super-resolution reconstruction results to optimize the detection task more directly. The overall structure of the EFSOD network is shown in Figure 1.
In EFSOD, the generator mainly consists of the EESRM, which generates high-quality super-resolved images from low-resolution remote sensing images . To better capture and preserve edge information in the images, this paper proposes the Edge Enhanced Dense Residual Module (EEDRM), which extracts edge information from the feature maps of each layer within the residual blocks and connects these edge details through residual connections.
In the generator's super-resolution reconstruction network, the low-resolution remote sensing image is first processed through an initial convolutional layer () to extract the basic features . Then, the extracted features are applied to three EEDRM to learn deeper features within the feature maps, using residual connections to facilitate the flow of information and obtaining the feature map after deep feature learning. Subsequently, the feature map is further processed through a convolutional layer () to extract the fused deep features . Finally, the learned feature map is upsampled using pixel shuffle technology to increase the image to the target resolution. Additional convolutional layers further enhance and refine the features, and a final convolutional layer converts the feature map into a high-resolution image . The undergoes feature extraction using the convolutional neural network ResNet50 [30] to obtain the feature map.
The object detection network is responsible for detecting and identifying objects in the generated images. We propose the CMFFM module to extend the object detection component. Firstly, to ensure dimensional consistency between the feature map extracted from the super-resolution reconstruction network and the feature map in the object detection network, we use a Feature Alignment function to adjust to match the size of as a feature map:
Then, and are concatenated at the channel level, denoted as:
where , and + respectively denote the height, width, and channels of the feature maps. is the super-resolution feature map after feature alignment. represents the feature map obtained by channel-wise concatenation and fusion of the aligned super-resolution feature map with the object detection feature map Fob.
This step effectively combines the features of the two networks, where the super-resolution feature map adds more detailed information and the object detection feature map incorporates richer high-level semantic information. The number of channels in the concatenated feature map will increase, and to meet the input requirements of the subsequent layers of the object detection network, it is necessary to adjust the number of channels in the feature map using a convolution operation , convert into a feature map with target channels.
where respectively denotes the adjusted target number of channels to match the input requirements of the object detection network.
This convolutional layer adjusts the number of channels and helps further integrate features from two different networks. It is then followed by a batch normalization layer (BN) to standardize the features, adjusting and scaling the incoming features to promote rapid convergence of the model.
where respectively denotes the feature map after batch normalization, denotes the batch normalization operation, standardizing the input features so that their mean is close to 0 and variance is close to 1.
Subsequently, the ReLU activation function is applied to maintain non-linear characteristics.
where is the feature map after RELU activation, the ReLU activation function is applied to enhance the features' nonlinear expressive capability.
Finally, the fused features output by the CMFFM module are:
where denotes the fused feature map output by the CMFFM.
This feature effectively integrates the detailed edge and texture information provided by the super-resolution network with the high-level semantic information from the object detection network, thereby enhancing the detection accuracy of small targets in remote sensing images.
This paper proposes the EESRM to better capture and preserve edge information in images. The EESRM primarily comprises the Edge-Enhanced Dense Residual Module (EEDRM), whose network structure is shown in Figure 2. Based on the dense residual structure, EEDRM incorporates an Edge Enhance Block (EEB) consisting of a convolution layer, an activation layer, and a Laplacian operator.
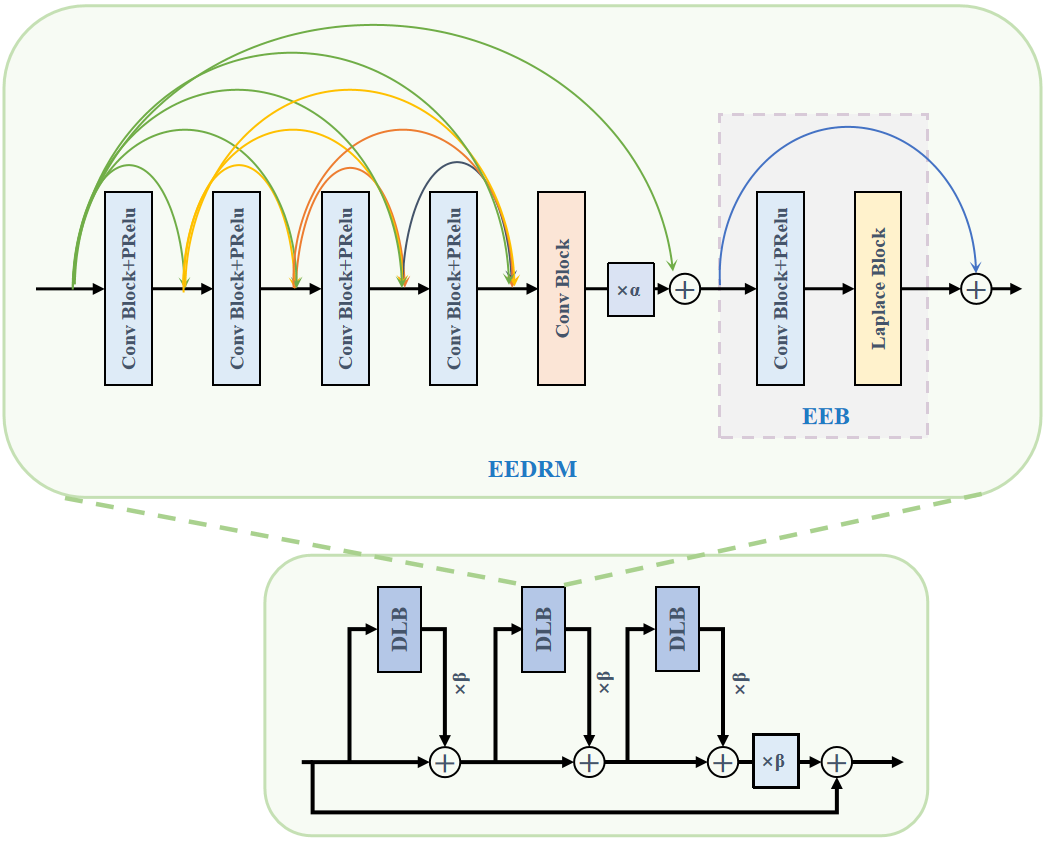
The EEB extracts high-frequency components from the feature layers extracted by the residuals using a Laplacian operator [31] and connects them with the original feature layers through residual connections. This process can be expressed as:
where represents the feature map extracted by the ith dense residual module, represents the edge information extracted by the edge enhancement module of , denotes the adjustment factor, and represents the edge-enhanced feature layer output through residual connection.
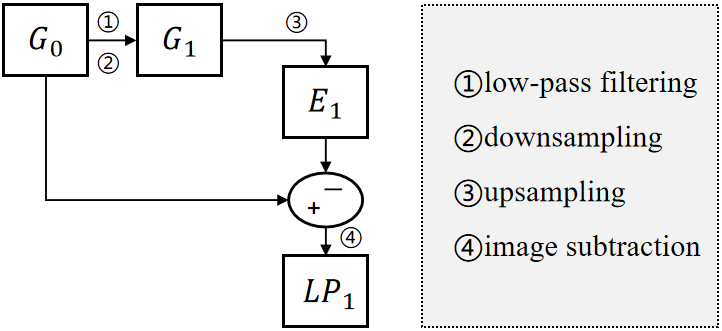
Motivated by the Laplacian operator, The structure is illustrated in Figure 3, the original image undergoes low-pass filtering and downsampling, followed by upsampling to restore the dimensions. Finally, the original image and the upsampled result are subtracted, a process that can be expressed as:
where is the upsampling, is the downsampling.we employ the Dense Residual Laplacian Block (DLB) as the basic unit to extract features from the original image. This approach preserves more high-frequency edge information without incurring significant computational overhead, thereby improving the accuracy of small object detection. The th DLB, the feature map is obtained through dense residual feature extraction. Due to repeated convolution operations, the edge information of small objects becomes weakened, resulting in ghosting artifacts in the generated images. Therefore, we embed an additional computation for edge information extraction within each dense residual block to enhance the high-frequency details of the image better, thereby achieving a more precise and refined super-resolution reconstruction.
For the feature extraction network of the super-resolution model, a 3×3 convolutional layer is first used to extract the shallow feature map from the image. This operation reduces the spatial dimensions of the feature maps, increases the receptive field of the network layers—thus enabling the capture of a broader range of features—and simultaneously decreases the volume of data subsequent layers need to process. This process can be expressed as:
where denotes the operation of a 3×3 convolutional layer. x denotes the low-resolution image.
Next, the shallow feature map is passed through a series of EEDRM to extract deep features containing edge information. In this process, the number of EEDRM blocks is set to three. This module employs dense residual connections through a multi-scale residual network and an edge feature extraction module to extract rich semantic information, thereby enhancing the feature representation capability of the target feature extraction module.Simultaneously, the output of each convolutional layer is connected via residual connections with all preceding convolutional layers to prevent the loss of feature information. Furthermore, the EEDRM employs the Laplacian operator to extract edge information from the image, and this extracted edge information is then integrated through residual connections with the previously extracted features, significantly enhancing the utilization of edge features. After the series of EEDRM blocks, an additional convolutional layer is applied, and its output is added to the shallow feature map to obtain the final deep feature . This process can be expressed as:
Then, the extracted deep features undergo a feature upsampling operation to increase their resolution to the desired size. A convolutional layer extracts features while preserving spatial resolution, followed by an activation function to introduce non-linearity for learning complex features.
Finally, a second convolution and activation operation is performed to refine the target features further, enhancing detail restoration and deep feature extraction. The ultimately extracted target features can be expressed as:
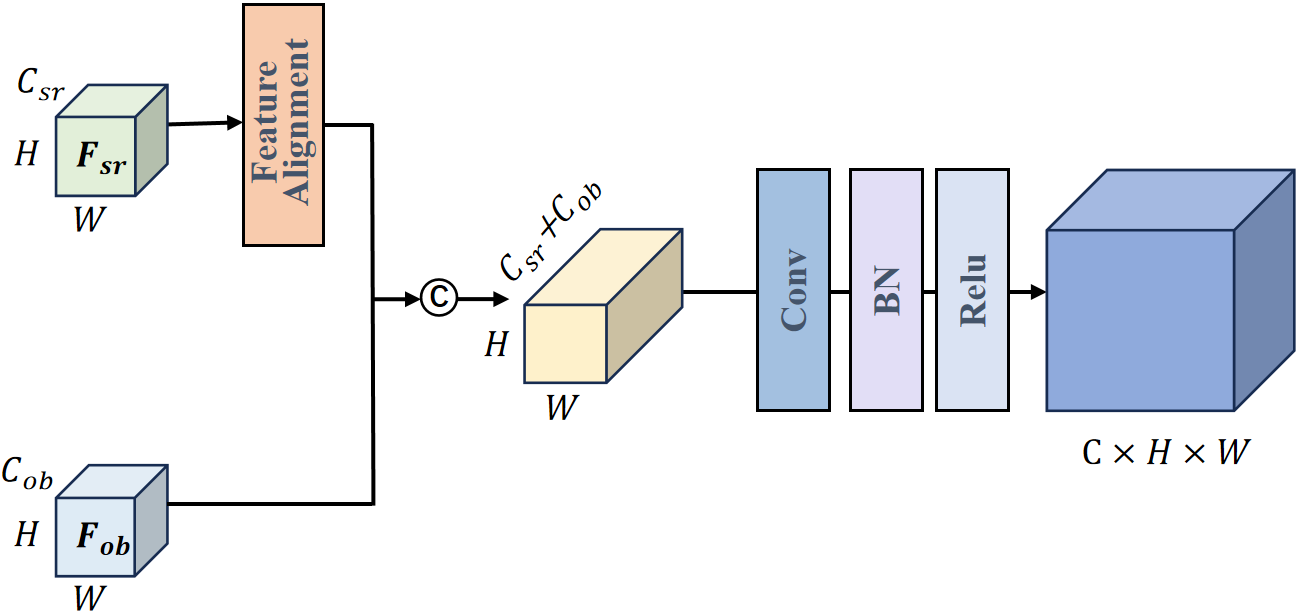
To integrate super-resolution features with target detection features and obtain superior detection performance, this paper proposes the CMFFM. The core objective of this module is to effectively fuse the target features extracted by the super-resolution reconstruction network into the feature maps extracted by the target detection network. By leveraging the detail enhancement capability of the super-resolution network and the recognition and localization expertise of the target detection network, the proposed method jointly improves detection performance. This approach introduces the super-resolution network's sensitivity to fine details without compromising the target detection network's spatial perception capability, thereby achieving effective feature fusion between the two networks and enhancing overall target detection performance.
The network structure of CMFFM is shown in Figure 4. represents the number of channels in the super-resolution feature map, and represents the number of channels in the target detection feature map. H and W denote the height and width of the feature maps, respectively. refers to a 1×1 convolutional layer, BN represents Batch Normalization, and Relu denotes the nonlinear activation function.
During the cross-model feature fusion process, the given inputs include the target features extracted from the super-resolution reconstruction network and the features extracted from the backbone of the target detection network.First, it is necessary to ensure that the target features generated by the super-resolution model match the spatial dimensions of the final output layer of the target detection backbone network. To achieve this, the size of the additional features is adjusted using bilinear interpolation to align with the dimensions of the backbone features. The proposed feature fusion network employs a series of feature fusion operations using concatenation to merge cross-model features along the channel dimension. This process can be expressed as:
where is the feature concatenation operation along the channel dimension.
Then, the merged features are transformed into the target number of channels through the 1×1 convolutional layers in CMFFM. Subsequently, batch normalization and the ReLU activation function are applied to enhance feature representation and the network's nonlinear capability. The final fused feature can be expressed as:
where is the 1×1 convolution operation, BN denotes batch normalization processing, and represents the application of Relu as the nonlinear activation function.
After the CMFFM processing, the fused features effectively combine multi-level information, incorporating rich high-level semantic representations. This mechanism successfully integrates critical attributes such as target categories and properties into the final feature encoding, enabling object detection models to leverage these advanced semantic cues for more precise localization and classification. Notably, the feature fusion module preserves sufficient spatial resolution throughout the fusion process, ensuring the retention of spatial fidelity at the feature level without compromising detection accuracy. The resultant fused features, enriched with comprehensive detail and semantic depth, significantly enhance the model's capability to capture subtle characteristics and small targets. By synergistically integrating heterogeneous feature sources, the framework improves the model's contextual understanding of inter-object relationships in complex scenes. It demonstrates outstanding performance advantages in detecting small targets within challenging environmental contexts.
The network involved in this paper consists of a super-resolution network based on Generative Adversarial Networks (GANs) and a target detection network. During the training process, an end-to-end training approach is used, where the loss from the target detection is backpropagated to the generation network, guiding the generation network to reconstruct images that are more conducive to target detection.
We introduce a new loss in addition to the traditional adversarial loss, perceptual loss , and L1 loss to prevent the edge enhancement module from over-enhancing the edges. Specifically, we use Charbonnier loss, i.e., the consistency loss , between the super-resolved image (SR) and the high-resolution image (HR).
where is the average value of all generated images in a batch. At the same time, and denote the feature representations extracted by the convolutional neural network when the actual image and the super-resolved image are fed into the network, respectively. is Charbonnier function.
Finally, we obtain the total loss of the edge-enhanced super-resolution generation network by adding the loss of the edge enhancement module to the original generative network's loss, with the empirical value set to , , ,
where is the adversarial loss of the generator.
In the target detection network, Faster R-CNN, regression loss, and localization loss exist for the detected objects. Both losses are computed using the smoothed L1 loss. The classification loss , regression loss , and total detection loss can be expressed as:
where is the ground truth target coordinates, denotes the super-resolution reconstruction network, is the classification loss in the target detection network, denotes the regression loss in target detection, refers to the smoothed loss, and is the balancing parameter. In the proposed network,
The total loss of the entire discriminator can be expressed as:
where is the adversarial loss, and is the balancing parameter for the discriminator loss, which measures the contribution of the target detection network to the discriminator. Based on empirical experience, is set to 1.
Finally, the overall loss of the entire network architecture, , can be expressed as:
This section designs an image degradation method to simulate actual remote sensing image formation to validate the effectiveness of the proposed EFSOD. This ensures that the super-resolution target detection model has better generalization ability and adapts more effectively to real-world scenarios. First, we conduct comparative experiments between EFSOD and baseline networks. Then, we compare the EFSOD algorithm with other super-resolution target detection methods. Finally, an ablation analysis is performed on the proposed modules.
Currently, the two mainstream datasets in the field of super-resolution target detection are the COWC [32] and RSOD [33] datasets. The COWC (Cars Overhead With Context) dataset consists of satellite images collected from six different geographic locations, with an image size of 256×256 pixels. The average target length ranges from 24 to 48 pixels, while the width ranges from 10 to 20 pixels. This dataset focuses solely on small targets of the "car" category and includes 3954 images for training and testing. 3164 images were randomly selected as the training set, while 790 were used as the test set. The RSOD dataset includes four types of objects: airplanes, sports fields, overpasses, and oil tanks. These objects exhibit diverse characteristics and have targets of varying sizes. The experiments divided this dataset into training and test sets in an 8:2 ratio.
Most methods for small target detection in super-resolution remote sensing rely on downsampling to create low-resolution datasets without considering the imaging characteristics of remote sensing images in practical scenarios. This leads to models that perform well on specific datasets but fail to generalize well on others, undermining their robustness and generalization ability. Figure 5 shows remote sensing image degradation methods, including blurring, downsampling, noise, and image compression.
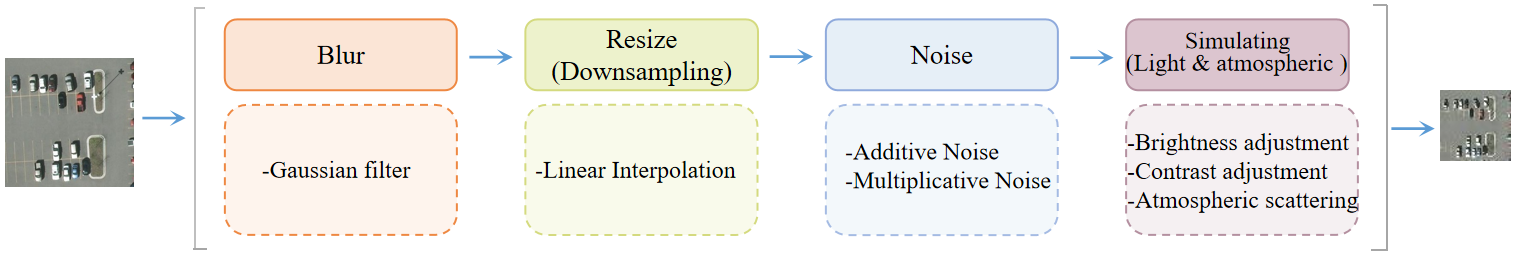
Before model training, to obtain paired high/low-resolution images, it is necessary to preprocess the images in the dataset. A crucial part of this process is degrading the high-resolution remote sensing images to simulate the real remote sensing image generation environment. Let and represent the initial high-resolution image and its degraded low-resolution version, respectively. , , and correspond to the number of channels, height, and width of the input image.
First, Gaussian blurring is applied to the input high-resolution image . The blur kernel is based on a Gaussian probability density function with zero mean to achieve , resulting in . This process can be represented as:
where is the Gaussian blur function.
Secondly, considering that remote sensing images are inevitably affected by noise during the generation process, this paper focuses on two types of noise: additive noise in optical imaging systems and multiplicative features in remote sensing image imaging systems. Additive and multiplicative features are sequentially added to the blurred image. This process can be expressed as:
where is additive noise, which follows a normal distribution . represents multiplicative features, where each image pixel is multiplied by a gain factor . This gain factor follows an exponential distribution with unit mean .
The resolution of the image is reduced through downsampling to simulate the situation of a low-resolution remote sensing image, resulting in the low-resolution remote sensing image . This process can be expressed as:
where represents the downsampling operation applied to the image.
Finally, the image parameters are adjusted to simulate remote sensing images under different sunlight conditions. This process can be expressed as:
where is the brightness adjustment factor, is the contrast adjustment factor, and is the average brightness of the image.
In addition, to account for light attenuation caused by atmospheric scattering and the increase in ambient light due to scattering, the image after atmospheric scattering processing is the final low-resolution remote sensing image . The effect of atmospheric scattering on the image can be expressed as:
where is the image brightness at position after the influence of atmospheric scattering, is the brightness of the original image at position , is the atmospheric scattering coefficient, is the distance at position in the scene, and is the ambient light intensity.
Through the above degradation processing, this paper simulates more realistic low-resolution remote sensing images in the data processing, providing a solid foundation for the subsequent training and testing of the network.
For the images in the dataset, this paper first processes the original images using the proposed degradation method to obtain low-resolution images, forming high/low-resolution image pairs. During training, the low-resolution and high-resolution images are fed into the network for training. The parameter settings are as follows: the batch_size is set to 5, the learning rate for the super-resolution reconstruction network is initialized to 500, and the Adam optimizer parameters are set to and . For the object detection network, the initial learning rate is set to 0.005, and the momentum parameter of the SGD optimizer is set to 0.9. The network is trained in an end-to-end manner. During the testing phase, only the low-resolution images must be input for super-resolution object detection without requiring high-resolution images.
This paper uses the MS COCO [22] evaluation matrix to evaluate the object detection results. It selects , , , , , , and as the verification criteria for the effectiveness of the object detection experiments to assess the performance of the degradation model.
| Method | Train/test | PSNR | ||||
|---|---|---|---|---|---|---|
| EFSOD | Bicucic/Degradation | 28.18 | 57.10 | 0.409 | 0.443 | - |
| EFSOD | Degradation/Degradation | 31.20 | 87.00 | 0.731 | 0.783 | - |
| Method | ||||||||
|---|---|---|---|---|---|---|---|---|
| ESRGAN+FRCNN | 0.843 | 0.709 | 0.744 | - | 0.715 | 0.729 | 0.786 | - |
| EESRGAN | 0.893 | 0.744 | 0.779 | - | 0.768 | 0.771 | 0.815 | - |
| EFSOD | 0.892 | 0.773 | 0.841 | - | 0.799 | 0.801 | 0.847 | - |
| Method | ||||||||
|---|---|---|---|---|---|---|---|---|
| ESRGAN+FRCNN | 0.859 | 0.720 | 0.753 | 0.799 | 0.722 | 0.734 | 0.781 | 0.825 |
| EESRGAN | 0.902 | 0.771 | 0.806 | 0.839 | 0.763 | 0.781 | 0.822 | 0.858 |
| EFSOD | 0.913 | 0.779 | 0.854 | 0.865 | 0.808 | 0.820 | 0.861 | 0.877 |
| Method | Param | FLOPs |
|---|---|---|
| ESRGAN+FRCNN | 53.51 | 120.32 |
| EESRGAN | 106.69 | 217.41 |
| EFSOD | 60.60 | 106.86 |
This paper evaluates the proposed EFSOD's object detection performance on remote sensing images from both subjective and objective perspectives. Considering the specific characteristics of remote sensing images, the original images are processed with blurring, downsampling, noise, simulated lighting changes, and atmospheric scattering when generating low-resolution images. In the comparative experiments with the baseline networks, ESRGAN+FRCNN and EESRGAN networks are compared with the proposed network, evaluating the networks from both object detection metrics and parameter/computation complexity aspects. EESRGAN adopts an end-to-end structure similar to our method. Additionally, this paper compares current mainstream object detection algorithms such as Faster RCNN++ [34], RetinaNet [35], CenterNet [36], and PP-YOLOv2 [37], as well as remote sensing small target detection algorithms like AVDNet [38], the target feature super-resolution vehicle detection algorithm TGFSR-VD [39], and ASAHI [40]. All of the above algorithms are based on the official code provided, and experiments are conducted with consistent experimental parameters as described in the papers, trained, and tested on the COWC and RSOD datasets.
In order to verify the effectiveness of the degradation model, this section is based on the COWC data set, and the models proposed in this chapter are trained on the image data set after bicubic downsampling and the image data set after degradation method processing, respectively, then the test is performed uniformly on the low-quality degraded images that simulate the actual application scenarios. The experimental results are shown in Table 1.
As can be seen from the experimental results in Table 1, the model trained with the degradation data set, the Peak Signal-to-Noise Ratio (PSNR) is improved by 3.02, and the target detection accuracy is only selected as the evaluation parameter in this section. It can be seen that the target detection-related indicators have been greatly improved, including 29.9%, 32%, and 34%. The experimental results show that compared with the simple bicubic downsampling method, the degradation method adopted in this chapter can better simulate factors such as illumination and atmospheric scattering in the practical application of remote sensing images.This method can more accurately simulate the performance of images under different lighting conditions, including light intensity, shadow change, etc., which makes the model more robust and generalization ability in training. At the same time, considering the influence of atmospheric scattering and other phenomena on the image, the degradation method can also simulate the influence of these factors on image details and contrast, and provide more prosperous and more realistic training samples for the model. Through this detailed degradation simulation, the generated low-resolution image is closer to the actual remote sensing image, which makes the trained model more robust and reliable in the real scene. This method provides important support for improving the robustness and stability of the model and helps the model achieve better performance in practical applications.
Therefore, in the subsequent experiments, this paper uniformly adopts the degraded image data set as the low-resolution data set, and by using these low-resolution data that are closer to the real situation, we can improve the accuracy of image processing, models can be better trained to adapt to changes and challenges in real-world environments. Such training data helps to improve the generalization ability and robustness of the model, making it more robust and reliable in actual scenarios.
To verify the small target detection performance of EFSOD, this section conducts comparative experiments between the baseline networks ESRGAN+FRCNN, EESRGAN, and EFSOD on the COWC and RSOD datasets, respectively. The experimental results are shown in Tables 2 and 3.
As shown in Table 2, on the COWC dataset, EFSOD significantly improves all object detection metrics compared to ESRGAN+FRCNN. Specifically, in terms of accuracy, the most critical metric, , increases by 5.8%, while the accuracy for small object detection, , improves by 9.0%. The average accuracy for medium-sized objects, , sees the highest increase of 13.0%. Since the COWC dataset does not contain large objects, the corresponding experimental results are denoted as "-". In terms of recall, EFSOD also demonstrates notable improvements. The overall recall rate, , increases by 11.7%, while the average recall for small objects, , improves by 9.9%, and the average recall for medium-sized objects, , increases by 7.8%.
Compared to the EESRGAN network, although the overall object detection accuracy decreases by 0.1%, EFSOD performs well in other metrics. Specifically, small object detection accuracy increases by 3.9%, while the average accuracy of medium-sized objects achieves the highest improvement of 7.9%. In terms of recall, EFSOD also shows significant enhancements. The overall recall rate increases by 4.0%, while the average recall for small objects improves by 3.89%, and the average recall for medium-sized objects increases by 3.9%. As shown in Table 3, compared to ESRGAN+FRCNN, EFSOD achieves the highest values across all metrics. Specifically, reaches 91.3%, the average accuracy for small objects reaches 77.9%, the average accuracy for medium-sized objects reaches 85.4%, and the average accuracy for large objects reaches 86.5%. Similarly, recall performance is significantly improved. The overall recall rate reaches 80.8%, the average recall for small objects reaches 82.0%, the average recall for medium-sized objects reaches 86.1%, and the average recall for large objects reaches 87.7%. EFSOD also achieves promising results on the RSOD datase.
The proposed EFSOD effectively integrates features from the super-resolution reconstruction network into the object detection task, enhancing the utilization of super-resolution features. This allows the network structure of the super-resolution reconstruction-based object detection algorithm to be more compact, achieving efficient use of super-resolution features in object detection. Consequently, it has a significant positive impact on the accuracy of small object detection.
Considering the existence of resource constraints in practical applications, the number of model parameters (Params) and Floating Point Operations (FLOPs) are added as evaluation indicators in this paper, where the number of parameters reflect the size and complexity of the model, and the FLOPs reflects the complexity of the model, the higher the number of parameters is, the stronger the expression ability of the model is, and the more computing resources are required, which affects the storage requirements and model complexity. The computational amount measures the computational resources required for a forward propagation of the model, that is, the number of floating-point operations required for a single inference. Flops are usually used to measure the computational efficiency and speed of the model. The experimental results are shown in Table 4, because the EESRGAN increases a parameter amount and computational complexity relative to the ESRGAN+FRCNN network, although the parameter amount of the model is reduced relative to EFSOD. The model is more efficient than the ESRGAN+FRCNN network, however, the required network parameters and computing resource consumption increase significantly. In real applications, this increase may hinder the effective deployment and operation of models in resource-constrained environments due to the limitations of storage capacity and computing speed. Compared with EESRGAN, the EFSOD network reduces the number of parameters by 46.09 m and the amount of calculation by 110.55 GFLOPS, which can effectively extract the edge information of the image without increasing the number of parameters and the amount of calculation, to improve network performance.
In addition, EFSOD compared to the benchmark network ESRGAN+FRCNN, the number of parameters of the model increased by 7.09 m due to the addition of the edge-enhanced dense residual block EEDRM, which shows that EEDRM does not increase too many parameters and computational burden, and it can be used to improve the accuracy of the model, is a relatively lightweight edge enhancement module. In addition, the floating-point operation required by the algorithm per inference is reduced by 13.46 GFLOPS, which is because ESRGAN+FRCNN uses the FasterRCNN algorithm that comes with torchvision and uses a pre-trained model, which can be used to improve the performance of the algorithm, as a result, the amount of parameters and calculation of the model in the target detection network FasterRCNN is relatively large, while EFSOD uses the improved FasterRCNN and does not use the pre-training model, which reduces the calculation of the network.
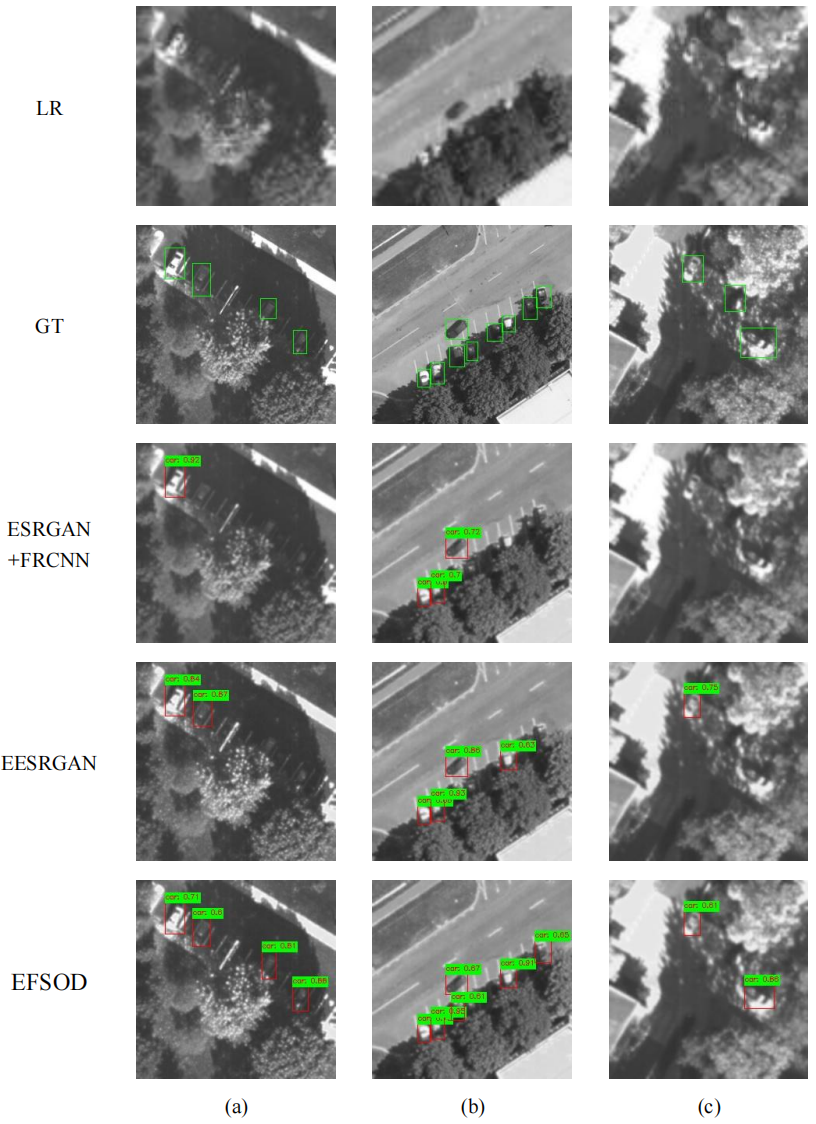
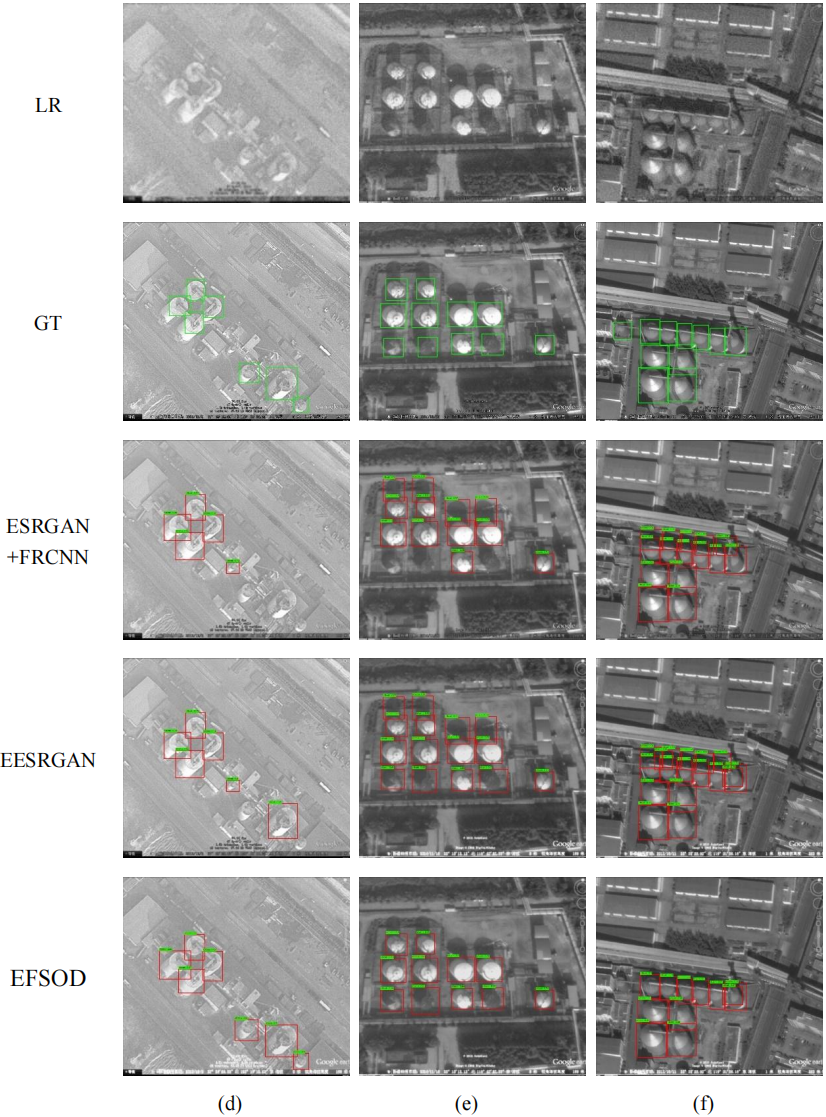
This section conducts an effectiveness analysis of EFSOD on three representative images selected from the COWC and RSOD datasets, as shown in Figures 6 and 7, to further verify and analyze its effectiveness. In the COWC dataset, the selected images contain partially occluded objects. In contrast, in the RSOD dataset, the chosen images feature objects that are difficult to distinguish from the background due to contrast factors. A comparative analysis is performed on these two types of images, and the detection visualization results are presented. Figures 6 and 7 consist of three columns from left to right: (a), (b), and (c) in one figure, and (d), (e), and (f) in the other, each representing one of the three selected representative images. Vertically, there are six rows corresponding to: the low-resolution images obtained after degradation processing, ground-truth, ESRGAN+FRCNN, EESRGAN, EESR-SOD and EFSOD. The confidence score of the detected objects is displayed in the upper right corner of the bounding boxes, with values ranging from 0 to 1.
Figures 6 and 7 demonstrate that ESRGAN+FRCNN fails to detect small objects with low contrast against the background or partial occlusion due to its lack of edge information extraction and utilization of other super-resolution features, as shown in Figures 6(a) and 7(e). EESRGAN, benefiting from the presence of an edge enhancement network, is more sensitive to object edges and can detect some low-contrast objects, as illustrated in Figures 6(b), 6(c), 7(e), and 7(f). However, due to the absence of other super-resolution feature applications, it fails to detect corresponding objects in images with complex lighting and significant noise, such as 6(c).In contrast, the proposed EFSOD integrates high-frequency edge information, which is crucial for object detection, and incorporates super-resolution object features extracted from the super-resolution network into the object detection feature map. As a result, EFSOD achieves better performance in scenarios with low contrast and high noise.
In summary, EFSOD significantly improves feature extraction and feature enhancement capabilities. While maintaining the parameter count, it achieves enhancements across various object detection metrics, with particularly noticeable improvements in small object detection. Specifically, EFSOD exhibits more substantial recognition capabilities, enabling better identification of small objects in low-contrast and high-noise scenarios.
| Method | ||||||||
|---|---|---|---|---|---|---|---|---|
| FasterRCNN | 0.652 | 0.476 | 0.526 | - | 0.542 | 0.535 | 0.632 | - |
| RetinaNet | 0.610 | 0.489 | 0.588 | - | 0.502 | 0.511 | 0.600 | - |
| CenterNet | 0.693 | 0.575 | 0.622 | - | 0.587 | 0.605 | 0.669 | - |
| PP-YOLOv2 | 0.751 | 0.595 | 0.731 | - | 0.691 | 0.711 | 0.755 | - |
| AVDNet | 0.719 | 0.598 | 0.604 | - | 0.652 | 0.616 | 0698 | - |
| TGFSR-VD | 0.851 | 0.714 | 0.739 | - | 0.714 | 0.727 | 0.779 | - |
| ASAHI | 0.866 | 0.763 | 0.759 | - | 0.744 | 0.701 | 0.773 | - |
| EFSOD | 0.892 | 0.773 | 0.841 | - | 0.799 | 0.801 | 0.847 | - |
| Method | ||||||||
|---|---|---|---|---|---|---|---|---|
| FasterRCNN | 0.655 | 0.547 | 0.625 | 0.700 | 0.622 | 0.555 | 0.632 | 0.659 |
| RetinaNet | 0.702 | 0.586 | 0.645 | 0.693 | 0.663 | 0.566 | 0.676 | 0.690 |
| CenterNet | 0.711 | 0.591 | 0.680 | 0.720 | 0.612 | 0.695 | 0.709 | 0.719 |
| PP-YOLOv2 | 0.817 | 0.750 | 0.769 | 0.798 | 0.749 | 0.758 | 0.790 | 0.822 |
| AVDNet | 0.762 | 0.602 | 0.709 | 0.752 | 0.630 | 0.709 | 0.721 | 0.759 |
| TGFSR-VD | 0.876 | 0.745 | 0.774 | 0.805 | 0.756 | 0.759 | 0.806 | 0.818 |
| ASAHI | 0.882 | 0.751 | 0.785 | 0.811 | 0.769 | 0.770 | 0.808 | 0.811 |
| EFSOD | 0.913 | 0.758 | 0.781 | 0.865 | 0.808 | 0.820 | 0.861 | 0.877 |
To validate the model's performance, this section presents a comparative analysis of EFSOD against other state-of-the-art general object detection algorithms and specialized small object detection algorithms for the remote sensing domain. The detailed results are shown in Tables 4 and 6. The comparison includes the following methods: Faster RCNN++ [34], RetinaNet [35], CenterNet[36], PP-YOLOv2[37], AVDNet[38], TGFSR-VD[39], and ASAHI [40].
Tables 5 and 6 show that EFSOD demonstrates outstanding performance on the COWC and RSOD datasets. The highest values among all compared methods are highlighted in bold, while the second-best values are underlined. On the COWC dataset, EFSOD achieves the highest scores across all metrics, with reaching 89.2%, at 77.3%, and at 84.1%, reflecting its accuracy in object detection tasks. In terms of recall, reaches 79.9%, exceeding the second-best value by 5%, while reaches 80.1%, highlighting its significant advantage in small object recall tasks. Additionally, reaches 84.7%, emphasizing its superior performance in object detection. Since the COWC dataset does not contain large objects, the corresponding results are marked as "-". On the RSOD dataset, EFSOD continues to perform exceptionally well, achieving of 91.3%, of 75.8%, of 78.1%, and of 86.5%, further confirming its outstanding performance in object detection tasks. In terms of recall, reaches 80.8%, reaches 82.0%, reaches 86.1%, and reaches 87.7%, demonstrating EFSOD's overall superior capability. The EFSOD network proposed in this paper achieves the best overall experimental results in small target detection.
The main reasons are as follows: First, the proposed Edge-Enhanced Dense Residual Module effectively extracts edge information of small objects, facilitating their distinction from the background and reducing the interference of lighting and color variations in detection. Second, the Edge-Enhanced Super-Resolution Reconstruction Module possesses intense feature extraction and enhancement capabilities, effectively extracting features beneficial to object detection tasks. This module also identifies and leverages the correlation between super-resolution and object features. Finally, the Cross-Model Feature Fusion Module in the object detection network effectively integrates the extracted super-resolution object features with object detection features, significantly improving detection performance. By deeply integrating the super-resolution reconstruction network with the object detection network, the EFSOD framework fully utilizes and efficiently fuses features beneficial to object detection from the super-resolution network. This approach offers a novel perspective for small object recognition based on super-resolution reconstruction, significantly improving detection accuracy and recall rates.
| Method | CMFFM | EEDRM | ||||||||
|---|---|---|---|---|---|---|---|---|---|---|
| ESRGAN+FRCNN | 0.843 | 0.709 | 0.744 | - | 0.715 | 0.729 | 0.786 | - | ||
| 0.875 | 0.744 | 0.778 | - | 0.754 | 0.761 | 0.81 | - | |||
| 0.87 | 0.731 | 0.783 | - | 0.756 | 0.759 | 0.806 | - | |||
| EFSOD | 0.892 | 0.773 | 0.841 | - | 0.799 | 0.801 | 0.847 | - |
| Method | CMFFM | EEDRM | ||||||||
|---|---|---|---|---|---|---|---|---|---|---|
| ESRGAN+FRCNN | 0.859 | 0.720 | 0.753 | 0.799 | 0.722 | 0.734 | 0.781 | 0.825 | ||
| 0.907 | 0.750 | 0.788 | 0.834 | 0.753 | 0.772 | 0.820 | 0.865 | |||
| 0.895 | 0.758 | 0.781 | 0.826 | 0.745 | 0.761 | 0.815 | 0.851 | |||
| EFSOD | 0.913 | 0.758 | 0.781 | 0.865 | 0.808 | 0.820 | 0.861 | 0.877 |
To verify the proposed CMFFM and EEDRM contribution to target detection accuracy, this section designs four comparative experiments on the baseline ESRGAN+FRCNN network using two different datasets, COWC and RSOD. Tables 7 and 8 show the performance comparison of each module on target detection.
From the performance shown in Tables 7 and 8, in the COWC dataset, both the CMFFM and EEDRM modules contribute significantly to improving the target detection accuracy of the baseline network ESRGAN+FRCNN. Regarding various metrics, the contribution of CMFFM is more significant than that of EEDRM. Specifically, in terms of accuracy, the most critical metric, improves by 5.8%. In contrast, the small target detection accuracy, an important metric in this paper, , improves by 9.0%, and improves by 13.0%. There is also a substantial improvement in recall, with increasing by 11.7%, by 9.8%, and by 7.7%. In the RSOD dataset, similar to the experimental results in the COWC dataset, both modules, when used individually, effectively enhance the target detection performance compared to the baseline network ESRGAN+FRCNN. However, fully integrating the edge-enhanced dense residual block and the cross-model feature fusion module leads to better performance. Regarding accuracy, when , increases by 6.3%, by 5.3%, by 3.7%, and L by 8.3%. In terms of recall, increases by 11.9%, by 11.7%, by 10.2%, and L by 6.3%.
Introducing the CMFFM module in the target detection network dramatically enhances the feature extraction and fusion capabilities, significantly improving overall performance compared to the baseline network. The success of this improvement can be attributed to the effective combination of two key factors: First, the edge-enhanced super-resolution reconstruction network effectively restores high-frequency edge details of the image and fully exploits the relevant features beneficial for target detection within the super-resolution reconstruction network, significantly improving the quality of super-resolution target features. Second, the CMFFM module precisely and effectively integrates these excellent super-resolution target features with target detection-related features, further enhancing the performance of the target detection feature extraction network while maintaining the superior features of the super-resolution reconstructed image. This fusion strategy not only helps improve the accuracy of small target detection but also enhances the robustness and generalization ability of the network under challenging conditions such as complex backgrounds and lighting variations.
To address the issue of insufficient feature utilization in super-resolution object detection networks, we propose the EFSOD. The core advantage of this network lies in its ability to fully exploit the consistent features between the super-resolution reconstruction network and object detection, providing intense feature extraction and enhancement capabilities. The EESRM enhances the edge information of the reconstructed image, solving the problem of unclear, small target edges that lead to detection difficulties, thereby improving the detection accuracy of small targets. The CMFFM also enables the effective fusion of the edge-enhanced super-resolution reconstruction network with the object detection network. Experimental results show that the EFSOD network has strong feature extraction capabilities. It performs well in complex scenes and scenarios with dense, small target distributions.
 Copyright © 2025 by the Author(s). Published by Institute of Emerging and Computer Engineers. This article is an open access article distributed under the terms and conditions of the Creative Commons Attribution (CC BY) license (https://creativecommons.org/licenses/by/4.0/), which permits use, sharing, adaptation, distribution and reproduction in any medium or format, as long as you give appropriate credit to the original author(s) and the source, provide a link to the Creative Commons licence, and indicate if changes were made.
 Chinese Journal of Information Fusion
ISSN: 2998-3371 (Online) | ISSN: 2998-3363 (Print)
Email: [email protected]

Portico
All published articles are preserved here permanently:
https://www.portico.org/publishers/iece/