


IECE Journal of Image Analysis and Processing
ISSN: request pending (Online)
Email: [email protected]

Over the past two decades, image fusion has become one of the most significant research fields in digital image processing, leading to the development and implementation of numerous approaches aimed at enhancing accuracy. This process involves merging two source images into a single, resultant image that conveys more meaningful and informative content than any individual source image could provide on its own. In some cases, the required information can only be revealed by merging a couple of images. High-quality visuals are essential in many such as security, computer vision [1], medical, military [2], remote sensing [3], navigation guidance for pilots, and weather forecasting [4].
Multi-focus imaging is one of the essential types of image fusion that has seen extensive research interest over the last few decades. Optical lenses are limited by their depth of field, meaning that only objects at a specific distance from the lens will appear sharp and in focus. As a result, in any given image, only one object will be in focus, while another object at a different distance from the lens will be out of focus and, hence blurred. Several factors contribute to the extent of this blurring, including the distance from the object, the focal length, the number of lenses used, and the distance between the lens and the sensor plane [5].
Multi-focus image fusion necessitates a variety of traditional and advanced approaches to produce a more informative resultant image. These approaches can be broadly categorized into a couple of classes such as spatial domain and frequency domain approaches. In the spatial domain, to deal with the image in its original form, meaning that the pixel values are directly manipulated based on the scene. On the other hand, frequency domain approaches focus on the rate at which pixel values change in the spatial domain.
Spatial domain approaches include averaging methods, Principal Component Analysis (PCA), simple maximum and minimum methods [6], and Intensity Hue Saturation (IHS) [7]. However, these approaches often produce subpar results due to spectral distortions, leading to low-contrast images with less information [4]. Additionally, the spatial domain doesn’t provide enough robustness and perceivable [8]. While, frequency domain approaches encompass techniques like pyramid transform, Discrete Wavelet Transform (DWT), Stationary Wavelet Transform (SWT) [9], and Discrete Cosine Transform (DCT) [10]. The benefits of the frequency domain are minimal processing complexity, ease of view, the ability to manipulate the frequency composition and special transformed domain property is easily applicable [8].
Frequency domain methods like DWT are effective for extracting frequency information from images but fall short in providing detailed directional information. The DWT approach has limitations such as the presence of ringing artifacts, longer processing times, problems with shift variance and additive noise, and higher energy consumption [10]. To resolve the DWT issues the SWT was introduced and this approach is a fully shift-invariant transform that eliminates the down-sampling step of the decimated approach by up-sampling the filters, placing zeros among the filter coefficients. This approach has a simpler architecture and provides higher time-frequency localization [11].
However, due to the aforementioned issues with frequency methods, researchers have been increasingly interested in using the DCT for multi-focus image fusion [10]. DCT-based methods are particularly efficient for transmitting and archiving images encoded in the JPEG standard. In the compressed domain, these approaches have performed better, avoiding the need for the complex and time-consuming decoding and encoding operations required by spatial-based algorithms [12]. As a result, DCT-based multi-focus image fusion algorithms consume importantly less energy and time [10].
In this article, the focus is on DCT-based approaches, which come in many variations. These variations are thoroughly analyzed to expand our understanding of the functionality of different DCT approaches. Moreover, the article provides a comparative analysis with advanced approaches, including DWT, SWT, and DCT-based variations, highlighting their respective advantages and disadvantages in Table 1. The purpose of this comparison is to help new readers with basic concepts and explore potential modifications for new approaches. The DCT-based methods examined include DCT + SVD, DCT + SVD + CV, DCT + Corr_Eng, and DCT + Corr_Eng + CV.
Various approaches have been developed for both spatial and frequency domains in the area of multi-focus image fusion. Additionally, the frequency domain offers more advantages over the spatial domain [8]. Hence, this study mainly focuses on the DCT approach. Its purpose is to highlight the maximum effective approaches by analyzing their characteristics and quality, as well as presenting experimental results obtained from image sets.
The DCT approach facilitates the transformation from the spatial domain to the frequency domain, making it possible to extract detailed and outline information from an image based on pixel frequencies. DCT is an effective approach for handling frequencies, offering a fast and straightforward solution by utilizing only cosine functions for the transformation. The Inverse Discrete Cosine Transform (IDCT) can then be used to reconstruct the original pixel values from the frequencies derived through DCT [20]. A finite sequence of data points is significantly represented by DCT as the sum of cosine functions that oscillate at different frequencies [21]. The process of DCT evaluation is as follows.
The two-dimensional DCT transform of an N×N (usually 8×8) block of an image (m,n) and the inverse DCT (IDCT) are defined in Eq.(1) and (3) respectively:
where and
where .
In Eq.(1), is the DC coefficient, which is the coefficient with zero frequency in both dimensions, and the other s are the AC coefficients, which are the remaining coefficients with non-zero frequency of the block.
SVD is a mathematical technique used to factorize a matrix into three component matrices. In the context of the DCT domain for image fusion, SVD helps in combining the important features of multiple images into a single, more informative image [13]. Decompose the DCT-transformed images Eq.(1) using SVD.
where is the DCT-transformed matrix, and are orthogonal matrices, and is a diagonal matrix containing the singular values. Combine the singular values from the corresponding matrices of the input images using a fusion rule, such as averaging or maximum selection.
where is the resultant singular value matrix, and are the singular value matrices of the reference image. Apply inverse SVD to the resultant matrices and then use IDCT to transform using Eq.(3) back to the spatial domain [14].
SVD + CV are applied in the DCT domain for multi-focus image fusion. This method enhances the fusion process by ensuring that the merged image retains the highly relevant information from both input images. Using SVD in the DCT domain helps in effectively capturing the frequency information, while CV ensures that the resultant image is consistent and free from inconsistencies or artifacts. Ensure that the fused singular values using Eq.(4) are consistent with the input images using Eq.(3) by verifying the consistency of the coefficients:
where, is a threshold, and are the DCT coefficients of the input images. If the difference is within the threshold, the value is kept; otherwise, it is discarded [13].
The Correlation Coefficient and Energy-Correlation Coefficient are computed in the DCT domain for an image fusion scenario. These metrics are essential in evaluating the quality of the resultant image, particularly in maintaining the correlation and energy consistency between the original and resultant images. Correlation coefficients are used to measure how effectively the fused image retains the information from the underlying photos, ensuring the quality of the resulting image. The Energy-Correlation Coefficient specifically measures how well the energy of the image (related to its contrast and brightness) is preserved during the fusion process.
The Correlation Coefficient between the original image and the fused image is computing using:
where and are the mean values of the original and resultant images, respectively.
The energy of an image in the DCT domain can be represented as:
where is the energy of the image , and are the DCT coefficients.
The Energy-Correlation Coefficient among the original image and the resultant image is computing using:
where and are the DCT coefficients of the original and resultant images, respectively.
For multi-focus image fusion in the DCT domain, the Correlation Coefficient, Energy-Correlation Coefficient, and Consistency Verification are employed. These techniques work together to ensure that the fused image maintains a high level of quality, retaining important information and energy consistency from the original images while ensuring that the fusion process produces reliable and accurate results. The DCT domain is particularly useful in this context because it allows the image’s frequency components to be manipulated, making it easier to merge images effectively. In order to ensure that crucial information is retained, the Correlation Coefficient calculates how well the fused image corresponds with the original images. The Energy-Correlation Coefficient evaluates how well the image’s energy (related to its contrast and brightness) is retained. Finally, consistency verification makes sure that the integrity of the fused image is maintained by preventing artifacts or inconsistencies from being introduced throughout the fusion process.
where, is a threshold, and are the DCT coefficients of the input images. If the difference is within the threshold, the value is kept; otherwise, it is discarded [13].
Entropy is one of the commonly used and important metrics to evaluate the information content of the resultant image. The higher values mean good results.
Correlation Coefficient (Corr) is an important measure that presents the correlation and also computes the similarity of spectral features between the reference and resultant images. The best value is close to the positive one, which depicts that the reference and resultant images are similar and if the image is dissimilar then the value is closer to zero [16].
Signal to Noise Ratio is a performance metric to use to find the ratio between information and noise of the resultant image. SNR higher values express that both the reference and resultant images are similar [17].
Peak Signal to Noise Ratio is a widely used performance metric, which is calculated by the number of gray levels in the image divided by the corresponding pixels in the reference and the Resultant images. The higher values indicate that the Resultant and reference images are similar [18, 19].
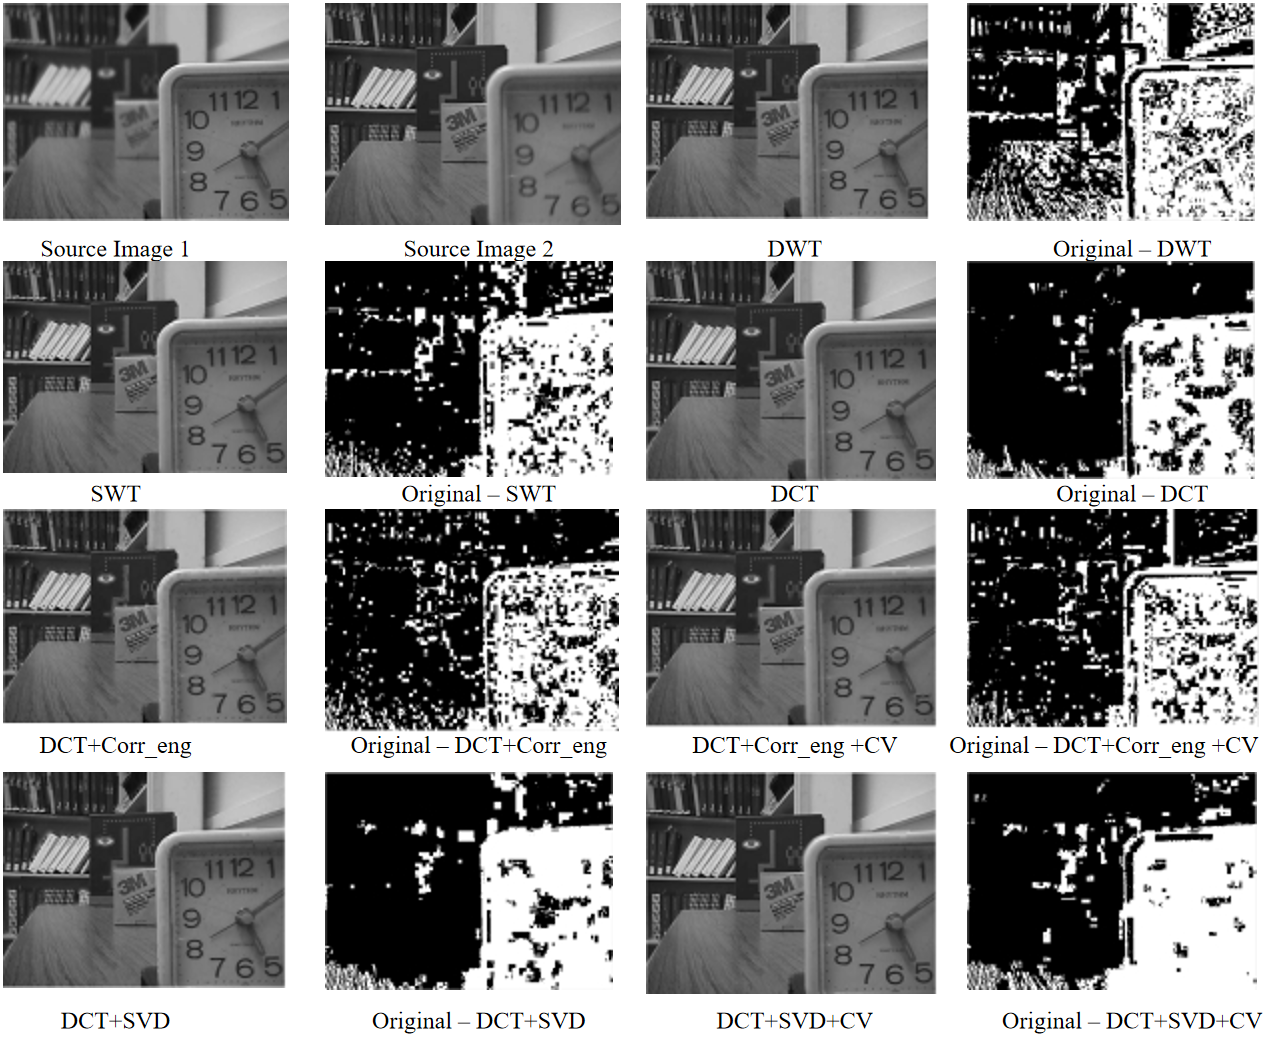
In this study, we conducted a comparative analysis of various image fusion techniques, including DWT, SWT, and DCT, along with several variations of DCT-based methods. The specific variations of DCT methods we explored include DCT + SVD, DCT + SVD + CV, DCT + Correlation and Energy (DCT + Corr_Eng), and DCT + Correlation and Energy with CV (DCT + Corr_Eng + CV). The effectiveness of these fusion techniques was rigorously assessed through three different types of performance metrics: qualitative error image (QEI) analysis, quantitative measures, and qualitative assessments. In this letter, the experiments are performed on Test image; “Clocks”. The grayscale image set is provided by “Lytro multi-focus datasets” [15].
To evaluate the quantitative performance, we utilized four specific metrics: entropy, SNR (Signal-to-Noise Ratio), PSNR (Peak Signal-to-Noise Ratio), and correlation. These were selected for their effectiveness in capturing various dimensions of fusion quality. Experiments were conducted on widely recognized multi-focus image datasets, specifically the disk dataset, with each image in the set having a resolution of 520×520 pixels.
For the image fusion process, we focused on fusing two images at a time, although the algorithms used are flexible enough to handle more than two multi-focus images. Additionally, we used the qualitative error image (QEI) technique to evaluate the fusion results. The QEI is essentially a difference image obtained by subtracting the resultant fused image from a reference image [10]. The less visible the QEI, the closer the fused image is to the reference image, indicating better fusion quality. This method provides a clear visual indication of how well the fusion process has preserved the important features of the original images [4].
| Metrics | DWT | SWT | DCT | DCT+Corr_eng | DCT+Corr_eng+CV | DCT+SDV | DCT+SDV+CV |
| entropy | 0.1790 | 0.1795 | 0.1834 | 0.1838 | 0.1675 | 0.1656 | 0.1690 |
| SNR | 15.6230 | 15.9438 | 15.6593 | 15.6855 | 15.5727 | 15.5455 | 15.7767 |
| PSNR | 35.9750 | 36.1354 | 35.9931 | 36.0062 | 35.9498 | 35.9363 | 36.0519 |
| Correlation | 0.9882 | 0.9891 | 0.9883 | 0.9884 | 0.9881 | 0.9880 | 0.9886 |
The qualitative results for all the fusion methods are illustrated in Figure 1, where we showcase both the final fused images and the corresponding error (or difference) images for each technique. While at first glance, the fused images across all methods may appear quite similar, with only minor differences, the true distinctions become evident when examining the qualitative error images. Notably, the fusion results and error images generated by the extended DCT + SVD approach are particularly impressive. It is clear that the difference image resulting from the DCT + SVD + CV method is more informative compared to DCT + SVD alone.
In our observations, when we closely examine and compare the error images in Figure 1 for all the fusion methods, it is evident that the qualitative performance of the DCT + SVD + CV method stands out across all three datasets. This approach consistently produces superior results, highlighting the effectiveness of incorporating CV into the fusion process.
The quantitative results, evaluated using four different metrics, reveal some intriguing insights. The statistical values across all the fusion methods are very close, indicating that each method performs well. However, as shown in Table 2, the DCT + SVD method stands out as the best performer for the disk image set. Despite the strong performance across the board, when we combine both visual and statistical assessments, it becomes clear that the DCT + SVD + CV method is the most superior among all the fusion techniques. This combination consistently outperforms the others, demonstrating its effectiveness in producing higher-quality fused images.
This study offers an in-depth examination of various image fusion techniques, with a particular focus on methods based on the Discrete Cosine Transform (DCT) and its advanced variations. It emphasizes the effectiveness of DCT in the frequency domain, especially for multi-focus image fusion when combined with Singular Value Decomposition (SVD) and Consistency Verification (CV). The results demonstrate that the DCT + SVD + CV method consistently outperforms others in both qualitative and quantitative assessments, making it the most effective for achieving high-quality image fusion. Experimental findings suggest that while techniques such as Discrete Wavelet Transform (DWT) and Stationary Wavelet Transform (SWT) have their advantages, DCT-based methods, particularly when enhanced with SVD and CV, offer a more balanced approach to preserving image details and structural integrity. The DCT + SVD + CV technique stands out for its ability to retain essential image information while reducing artifacts, leading to superior overall fusion quality.
Future research could explore several avenues for improving DCT-based fusion techniques. One potential area is the optimization of threshold values in Consistency Verification to adaptively enhance fusion accuracy for different image types. Additionally, incorporating machine learning models with DCT-based methods could automate the fusion process, potentially yielding even better results. Further research could also investigate extending these fusion techniques to handle more than two input images and applying them to different image modalities, such as infrared and visible light fusion, to test their robustness and versatility in various scenarios.
 Copyright © 2025 by the Author(s). Published by Institute of Emerging and Computer Engineers. This article is an open access article distributed under the terms and conditions of the Creative Commons Attribution (CC BY) license (https://creativecommons.org/licenses/by/4.0/), which permits use, sharing, adaptation, distribution and reproduction in any medium or format, as long as you give appropriate credit to the original author(s) and the source, provide a link to the Creative Commons licence, and indicate if changes were made.
 IECE Journal of Image Analysis and Processing
ISSN: request pending (Online)
Email: [email protected]

Portico
All published articles are preserved here permanently:
https://www.portico.org/publishers/iece/