


IECE Journal of Image Analysis and Processing
ISSN: request pending (Online)
Email: [email protected]

Malaria is a life-threatening infectious disease caused by Plasmodium parasites, transmitted through the bites of infected female Anopheles mosquitoes. This disease remains a critical challenge in global healthcare [1]. Plasmodium parasites are the cause of malaria. Humans can be infected by five different malaria parasites. These are Plasmodium falciparum, P. vivax, P. ovale, P. malariae, and P. knowlesi. Malaria signs typically appear 4 to 10 weeks after infection has occurred. In some cases, symptoms can take several months to appear. Some common signs of malaria disease include moderate to severe shivering, high fever, muscle pain, intense sweating, headache, vomiting, bloody feces, abdominal pain, diarrhea, nausea, and convulsions [2]. With millions of cases reported annually, particularly in tropical and subtropical regions, timely and accurate identification of malaria parasites in blood cells is paramount for effective treatment and control [3]. According to the World Malaria Report (2021), an estimated 241 million malaria cases in 2020, were slightly higher compared to 227 million in 2019. It was estimated that Malaria killed 627,000 individuals in 2020. Children under the age of five are in the most dangerous position. In 2020, 80 % of children worldwide died from malaria [4].
Studies indicate that malaria primarily affects young children under the age of five [5]. Untreated malaria patients may develop long-term pneumonia, anemia, yellow fever, respiratory or brain disorders (Cerebral Malaria) [6]. However, traditional microscopic examinations for accurate diagnosis take longer. The accuracy of malaria diagnosis depends on factors such as test costs, the sensitivity of the technique, attention to detail, the time required for the test, and the expertise of the person conducting it [7].
Therefore, there is a need for an advanced automated artificial intelligence-based model that can early and accurately detect malaria from human red blood cells. Malaria diagnosis through microscopic examination involves identifying Plasmodium parasites in stained blood films. This method, although highly specific and sensitive when performed by skilled technicians, is not always feasible in regions with limited access to trained personnel and adequate laboratory facilities. The variability in the quality of microscopy and the subjective nature of the examination can also lead to inconsistent results [8]. Machine learning and Deep learning models have been trained to classify malaria-infected blood cells with high accuracy like the use of ML techniques or model in image processing research [9, 10]. These models have been trained on a large dataset of microscopy images of blood cells, and can accurately classify the images as infected or not infected with the Plasmodium parasite [11].
Sawant et al. [8] utilized the ResNet-50, a deep CNN model with 50 layers that leverages residual learning. The authors implemented a custom ResNet-50 architecture which was designed to classify RBC images as infected or uninfected. ResNet-50 has been particularly effective in image recognition tasks due to its capability to mitigate the vanishing gradient problem, allowing for the training of very deep networks. The paper builds on prior work by incorporating transfer learning, which improves the model’s performance on limited datasets. Transfer learning allows the use of pre-trained models that can be fine-tuned to specific tasks, such as malaria detection. Additionally, the use of data augmentation techniques, such as image rotation and flipping, enhances the generalizability of the model by increasing the diversity of training data. Using the custom ResNet-50 architecture the authors achieved an impressive test accuracy of 97.8%, with precision 98.6%, recall of 97.2%, and F1 score of 97.8%.
Hoque et al. [12] leverages deep learning techniques such as ResNet50 MobileNet-v2 and Inception-V3. These models are widely recognized for their effectiveness in image processing and have been applied to malaria detection to achieve superior performance. The authors proposed a custom CNN architecture specifically designed for classifying infected and uninfected red blood cells. The architecture consists of five convolutional layers, five max-pooling layers, and two fully connected layers, optimized to handle the complexities of malaria detection. The model achieve high accuracy by leveraging advanced pre-processing techniques, including bilateral filter and image augmentation, making it well-suited for real-world clinical applications. The authors achieved 100% accuracy, with a precision of 100% and F1-score of 100% using the proposed CNN model. This model perform very well as compared to RestNet-50, Inception-v3, and MobileNet-v2.
Muhammad et al. [13] explores different deep learning architectures for malaria cell classification, including ResNet50, VGG16, and DenseNet, which have proven to be effective in detecting patterns and anomalies in medical images. These architectures utilize multiple layers to extract features such as shape, texture, and color from red blood cell images, ultimately distinguishing between infected and uninfected cells. The authors applies data augmentation techniques such as image rotation, scaling, and flipping to artificially expand the dataset and to improve the generalization of the model. The authors evaluated the performance of these models based on accuracy, precision, and F1-score. The study shows that deep learning models, especially ResNet50 and DenseNet achieve high accuracy in distinguishing between infected and uninfected cells.
Delgado-Ortet et al. [14] presents a novel three-stage deep learning pipeline to automate the detection of malaria using a combination of segmentation and classification techniques applied to red blood cell (RBC) images. The authors designed a Segmentation Neural Network (SNN) for red blood cell segmentation, which labels pixels in blood smear images to distinguish RBCs from other elements like white blood cells (WBCs) and platelets. The authors used a Convolutional Neural Network (CNN) for classifying segmented RBCs into two categories infected and uninfected. The study used data augmentation techniques such as cropping, rotation, and reflection to increase the diversity of training data. This helps in reducing overfitting and increases the ability to generalize new images. Using this approach the authors achieved 93.72% accuracy.
Deep Learning techniques particularly convolutional Neural Networks (CNN) have shown promising results in automating the detection of malaria from microscopic images of red blood cells (RBCs). Kakkar et al. [15] explored three CNN models for malaria detection. Basic CNN built from scratch using the Tensorflow and Keras libraries, this model has a simple architecture with convolutional and pooling layers. VGG-19 Frozen CNN, This is based on the VGG-19 architecture, known for its depth (19 layers). The weights are frozen (not updated during training) to leverage pre-trained knowledge. VGG-19 Fine-Tuned CNN, the VGG-19 is fine-tuned by updating the weights during training, allowing the model to adapt to the specific malaria dataset. The study provides a thorough comparison of three different CNN models, giving insights into how fine-tuning and pre-training affect performance. The testing accuracy achieved by basic CNN was 94%, frozen CNN was 92%, and fine-tuned CNN was 96%. Which is greater than basic CNN and frozen CNN. This result demonstrates the effectiveness of fine-tuning in improving model performance.
Irmak [16] introduced a novel CNN architecture specifically designed for malaria detection using thin blood smear images. The model consists of 20 weighted layers, including convolutional, ReLU, and max pooling layers designed to classify images as infected or uninfected. The model is trained and tested using a publicly available dataset containing 27,558 thin blood cell images. The dataset is split into training (60%), validation (20%,) and test (20%) sets, and a 5-fold cross-validation process is employed to ensure the model’s robustness. The model was evaluated based on accuracy, sensitivity, specificity, and precision. The proposed model achieves an overall accuracy of 95.28%, with high 95% sensitivity and 95.5% specificity, showing its effectiveness in detecting malaria from thin blood cell images.
Maqsood et al. [17] evaluated the effectiveness of various existing deep learning models including VGG, ResNet, DenseNet, Inception, Xception, and SqueezeNet for malaria detection from microscopic blood smear images, and proposes an efficient deep learning method for the classification of infected and uninfected malaria cells. The proposed method used bilateral filtering to improve image quality and image augmentation techniques for better generalization of the model. The authors presents a custom Convolutional Neural Network (CNN) model containing 5 convolutional and pooling layers. The proposed model outperforms all observed deep learning models, achieving an accuracy of 96.82% with a precision of 96.82% and an F1 score of 96.82%.
Hemachandran et al. [18] presented a performance analysis of three deep learning models CNN, MobileNetV2, and RestNet50. These models were trained and tested using a dataset sourced from the National of Health (NIH) which includes 27,558 images of infected and uninfected cells. Each model’s performance was evaluated using key metrics such as accuracy, precision, recall, F1-score, and the area under the receiver operating characteristic (ROC) curve. The describes the CNN model, which simplifies feature extraction through multiple convolution layers and activation functions like ReLU, MobileNetV2 reduces the number of parameters, making it efficient while retaining high classification accuracy and ResNet50 is known for solving the vanishing gradient problem through residual learning. MobileNetV2 achieved the highest accuracy of 97.06% and the highest AUC (96.73%) indicating its strong performance in distinguishing between infected and uninfected cells.
Pinkaew et al. [19] introduced an automated system for classifying Plasmodium falciparum and Plasmodium vivax from digitized images of thick blood films. The system employs a Support Vector Machine (SVM) for classification, using statistical features extracted from segmented sub-images of blood smears. These features include mean, standard deviation, kurtosis, skewness, and entropy, calculated across multiple color channels such as green (G), intensity (I), saturation (S), and value (V). These statistical measures capture the morphological textural difference between the two malaria species. The SVM classifier was trained and tested using sub-images from two malaria species. Two kernel types, Radial Basis Function (RBF) and Linear were evaluated. A training accuracy of 90% for P.falciparum and 93.33% for P.vivax and a testing accuracy of 85.71% for P.falciparum and 78.72% for P.vivax has been achieved. This demonstrates the classifier’s ability to differentiate between the two species with reasonable accuracy.
Widodo et al. [20] focuses on the detection of malaria in blood smear images using texture analysis and machine learning. The authors employ the Support Vector Machine (SVM) classifier, which is trained to differentiate between normal blood cells and those infected by Plasmodium falciparum. The research emphasizes texture-based feature extraction to capture critical patterns associated with malaria-infected cells. The study integrates segmentation techniques using the active contour method to isolate red blood cells from blood smear images. Texture features are extracted using methods like the Gray-level Co-occurrence Matrix (GLCM) and Gray-level Run Length Matrix (GLRLM). These features are then used to train the SVM classifier, which adopts a one-versus-all multiclass strategy to identify different phases of the malaria parasite including trophozoite, schizont, and gametocyte. The performance of the SVM classifier is evaluated using metrics such as accuracy, sensitivity, and specificity. Receiver Operating Characteristics (ROC) are also used to measure the classifier’s ability to distinguish between infected and uninfected cells across the different stages of malaria infection. The SVM model achieved a high accuracy of 93% for normal cells, 92.5% for trophozoite, 98.3% for schizont, and 100% for gametocyte.
This Section discussed the implementation of a Support Vector Machine (SVM), Logistic Regression Model, and Inception-V3 for the classification of malaria cell images as infected and uninfected.
The dataset is collected from the National Institutes of Health (NIH) [21] for this research and also available on Kaggle [22]. There are 27,558 cell images in total. It is divided into two categories: 13,779 parasitized and 13,779 uninfected cells. The sample infected and uninfected images can be seen in Figures 1 and 2.
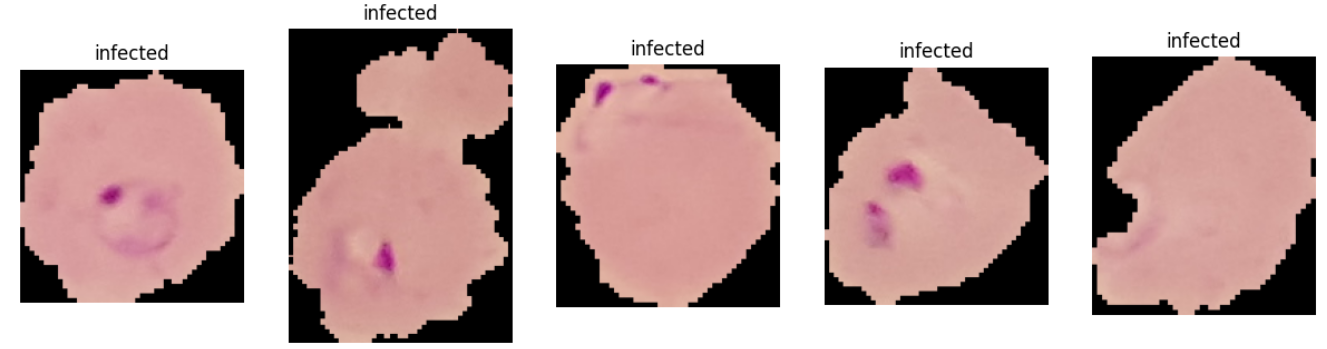
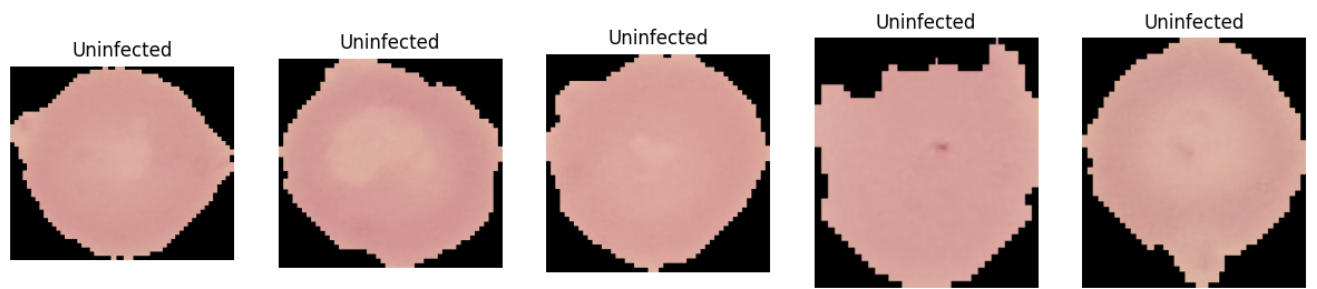
Infected images are those cells affected by malaria and uninfected are those cells which are not affected by malaria.
Pre-processing refers to the transformations applied to our data before feeding it to the algorithm. Data preprocessing is a technique that is used to convert the raw data into a clean data set [23]. In this study, we apply some pre-processing techniques to our dataset such as image resizing, color grading, and normalization. The images are resized to . The pixel values of the images are scaled to a range of between 0 and 1 and converted to grayscale.
Logistic Regression, a fundamental statistical model for binary classification tasks, is widely used in research for its simplicity and interpretability. It predicts the probability of an observation belonging to a specific class using the logistic function, defined as
where is a linear combination of the input features.
This probability is then used to assign observations to one of two categories, making Logistic Regression particularly suitable for tasks like disease detection. For this research, Logistic Regression was implemented to classify red blood cell images into two categories: infected and uninfected. The dataset, sourced from the National Institutes of Health (NIH) and Kaggle [21, 22], contained 27,558 cell images evenly distributed between the two classes. Preprocessing began with loading images from the infected and uninfected folders. The images were resized to pixels for uniformity and flattened into one-dimensional arrays for easier computation. The pixel values were normalized using a standard scaler to ensure the data had a mean of 0 and a standard deviation of 1, a critical step to improve the performance and convergence speed of the model. After preprocessing, the dataset was split into training (80%) and testing (20%) subsets using a stratified sampling technique to maintain the class distribution [24]. The Logistic Regression model was trained on the preprocessed training dataset with a maximum iteration count of 1000 to ensure convergence [25]. After training, the model’s performance was evaluated on the test set. The accuracy of the model was computed to be 65.38%, indicating its moderate effectiveness in classifying the images. Logistic Regression, due to its computational efficiency and robustness, proved to be an appropriate choice for this classification task. By leveraging these techniques, the research effectively demonstrated the application of Logistic Regression in automating malaria detection. The workflow, encompassing image preprocessing, normalization, and logistic modeling, underscores the model’s practical utility in medical image classification tasks. This work highlights the significance of preprocessing in enhancing model performance and showcases Logistic Regression as a reliable tool for binary classification in healthcare-related research.
SVM is a supervised machine learning algorithm widely used for classification and regression tasks. Proposed by Cortes and Vapnik, SVM operates by finding the optimal hyperplane that separates data points belonging to different classes in a high-dimensional space [26].
The strength of SVM lies in its ability to handle both linear and non-linear classification problems. For non-linear cases, it uses kernel functions such as radial basis functions (RBF) and polynomial kernels to transform data into a higher-dimensional space where a linear hyperplane can effectively separate the classes [27].
This makes SVM particularly robust for datasets with complex patterns. In this study, SVM was employed to classify malaria-infected and uninfected red blood cell (RBC) images. Before feeding the data into the SVM classifier, significant preprocessing and feature extraction were performed. The raw dataset of cell images, collected from the National Institutes of Health (NIH) and Kaggle repositories, was resized to pixels, converted to grayscale, and normalized to scale pixel values between 0 and 1. This preprocessing ensures that the input data is clean and uniform, facilitating better performance of the SVM classifier. Feature extraction was performed using the Histogram of Oriented Gradients (HOG) technique, which captures the structural and textural details of the images. The HOG method is highly effective for identifying gradient orientation patterns, which are crucial for distinguishing infected cells from uninfected ones. Dalal and Triggs first introduced the HOG technique for human detection tasks, demonstrating its robustness in object recognition [28].
The extracted HOG features were used to train the SVM classifier with a linear kernel, as it effectively handles the separability of our dataset. The dataset was split into training and testing sets, with 80% used for training and 20% for testing. After training, the SVM model achieved a high accuracy in classifying the malaria-infected and uninfected cells. This highlights the efficacy of combining preprocessing, HOG feature extraction, and SVM for medical image analysis. Studies have shown that machine learning algorithms like SVM can significantly improve diagnostic accuracy in medical imaging [29].
Additionally, the trained SVM model was further validated through a detection pipeline. For new cell images, preprocessing and HOG feature extraction were applied, followed by classification using the trained SVM model. The results demonstrated the reliability of the model in detecting malaria-infected cells, making it a promising tool for automated diagnostic systems. This approach aligns with findings from previous research, which emphasize the use of pre-trained models and feature extraction techniques for enhanced malaria detection [30].
Overall, the use of SVM for malaria detection provides a balance between simplicity and accuracy. By leveraging preprocessing, robust feature extraction, and a well-optimized linear kernel, SVM effectively distinguishes between infected and uninfected cells, contributing to the growing body of work in automated medical diagnostics.
InceptionV3, introduced by Szegedy et al. [31], is a deep convolutional neural network architecture known for its efficiency in computation and exceptional performance in image classification tasks. Its design incorporates advanced techniques like inception modules, factorized convolutions, and auxiliary classifiers, enabling multiscale feature extraction while reducing computational complexity. In this research, InceptionV3 was employed to classify red blood cell images into infected and uninfected categories, leveraging its ability to capture subtle patterns critical in medical imaging. The dataset was augmented using ImageDataGenerator from Keras, applying transformations such as rescaling, zooming, shearing, and horizontal flipping to enhance diversity and prevent overfitting. Transfer learning was used to retain the pre-trained InceptionV3 base for feature extraction, while custom top layers were added, including a GlobalAveragePooling2D layer, a Dense layer with 1024 neurons and ReLU activation, and a single output neuron with sigmoid activation for binary classification. The model was trained and evaluated using three optimizers, SGD, Adam, and RMSprop each configured with learning rates tailored to their respective characteristics [32, 33]. Performance was measured by training the model on the augmented dataset and validating it on a reserved validation set, followed by testing on unseen data. Results demonstrated the efficacy of optimizer selection in achieving high accuracy for malaria detection. The InceptionV3 architecture’s multi-scale feature extraction and gradient flow improvement significantly contributes to the model’s robust performance highlighting its suitability for complex medical image analysis tasks.
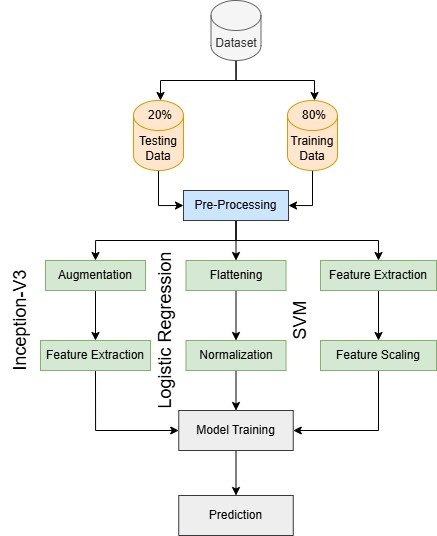
Figure 3 represents three distinct approaches for malaria detection: Inception-V3, Logistic Regression (LR), and Support Vector Machine (SVM), each applied separately to classify images. The dataset is initially split into 80% training and 20% testing subsets, followed by pre-processing where training images are resized to 150×150 pixels and normalized to [0,1] while testing images are resized to 64×64 pixels with color grading. In the Inception-V3 approach, data augmentation techniques, such as horizontal flipping, zooming, and shearing are applied to training images before passing them through Inception-V3 for feature extraction. These extracted features are then used for classification. The Logistic Regression approach flattens the images into 1D vectors, normalizes them, and trains them for classification. In the SVM approach, features are extracted using the Histogram of Oriented Gradients (HOG) technique, followed by feature scaling with StandardScaler to standardize the values before training an SVM classifier. Finally, each model independently classifies malaria-infected and uninfected images, allowing a comparative analysis of deep learning and traditional machine learning techniques for malaria detection.
At the initial stage of data preparation, the dataset is divided into three parts, consisting of training data, validation data, and test data. The training data is used to train the model [34, 35]. The validation data is applied during the learning process to assess performance and fine-tune the model. Finally, the test data is used in the evaluation phase to measure the model’s overall performance and ability to generalize.
| No | Data Split | Parasitized data | Uninfected data |
|---|---|---|---|
| 1 | Train Data | 9645 | 9645 |
| 2 | Data Validation | 2067 | 2067 |
| 3 | Test Data | 2067 | 2067 |
In the context of this study, different data-splitting strategies are employed based on the specific model being trained. For the Inception-V3, the dataset is divided into three subsets (70% for training, 15% for validation, and 15% for testing). Validation data plays a critical role in tuning hyper-parameters and monitoring performance during the training process, while the test data, unseen during training, ensures unbiased evaluation of the ensemble model. This distribution is detailed in Table 1.
| No | Data Split | Parasitized data | Uninfected data |
|---|---|---|---|
| 1 | Train Data | 11,023 | 11,023 |
| 2 | Test Data | 2,756 | 2,756 |
For Support Vector Machine (SVM) and Logistic Regression (LR) models, the dataset is split differently. For these models, the data is divided into 80% for training and 20% for testing, as validation data is not explicitly required. This simpler data division facilitates the direct evaluation of these individual models. The distribution for these scenarios is detailed in Table 2.
The Support Vector Machine (SVM) model was trained using a linear kernel on HOG (Histogram of Oriented Gradients) features extracted from preprocessed gray-scale images. The data, comprising "infected" and "uninfected" cell images, was split into 80% training and 20% testing subsets. The preprocessing pipeline included gray-scale conversion, resizing to 64×64 pixels, and normalization to ensure uniformity across samples. HOG feature extraction played a crucial role in capturing texture and structural details from the images, enabling the SVM model to effectively differentiate between the two classes. The SVM model achieved an accuracy of 84% on the test dataset, highlighting its effectiveness in identifying malaria-infected cells. However, this result also underscores the potential for further improvement through advanced techniques, such as feature selection, hyper-parameter optimization, or the use of non-linear kernels. The results are summarized in Table 3.
| Models | Accuracy |
|---|---|
| SVM | 84% |
| Logistic Regression | 65.38% |
The Logistic Regression (LR) model was trained on flattened and standardized grayscale images, with data split into 80% training and 20% testing subsets. The training process involved the use of a maximum iteration limit of 1000 to ensure convergence. The model achieved an accuracy of 65.38%. The detailed preprocessing pipeline and robust classification capability of Logistic Regression contributed to this performance. However, Logistic Regression may face challenges in capturing complex non-linear patterns, which could be addressed through feature engineering or advanced algorithms. The results are summarized in Table 3.
Inception-V3 model leveraged the ImageDataGenerator for preprocessing and augmentation. Trained for 1, 3, and 5 epochs, the model showed increasing accuracy with more training epochs, achieving 93.99%, 94.46%, and 94.52% accuracy, respectively. This highlights its superior ability to learn intricate patterns in the data compared to the other models. The accuracy of Inception-V3 is shown in Table 4.
| Models | 1 Epoch | 3 Epochs | 5 Epochs |
| Inception-V3 | 93.99% | 94.46% | 94.52% |
| Model | Features Used | Accuracy |
|---|---|---|
| SVM | HOG features | 84% |
| Logistic Regression | Flattened grayscale images | 65.38% |
| Inception-V3 | Full image | 93.99%(1 epoch),94.46%(3 epochs),94.52% (5 epochs) |
The SVM model, using HOG features and a linear kernel, achieved an accuracy of 84%, showcasing its ability to extract texture and structural details effectively. Logistic Regression, trained on flattened grayscale images, attained an accuracy of 65.38%, highlighting its simplicity but limited capability in handling complex patterns. In contrast, the Inception-V3 model demonstrated superior performance, with accuracy improving from 93.99% (1 epoch) to 94.52% (5 epochs), thanks to its deep architecture and robust feature extraction. While SVM and LR are simpler and computationally efficient, Inception-V3 excels in learning intricate patterns but at a higher computational cost. The results are detailed in Table 5.
This research sheds light on the advancements in malaria detection through the integration of machine learning and deep learning techniques. The study emphasizes the potential of automation in enhancing diagnostic accuracy and efficiency, addressing critical challenges in healthcare delivery within resource-limited settings. Logistic Regression achieved a baseline accuracy of 65.38%, showcasing the limitations of linear models for image-based classification. Support Vector Machines improved performance, attaining 84% accuracy by leveraging kernel-based techniques for feature separation. Inception-V3 excelled with a remarkable 94.52% accuracy, demonstrating the efficacy of deep learning in extracting intricate features from medical images. Although focused on malaria detection, the insights from this research extend to other medical imaging applications. Automated diagnostic systems, equipped with robust models like Inception-V3, have the potential to revolutionize disease management by reducing the dependency on manual assessments and mitigating diagnostic errors. This study provides a comparative analysis of machine learning and deep learning techniques, highlighting their respective strengths and limitations. By presenting a scalable solution for malaria detection, the research paves the way for further innovations in medical imaging. Future research should explore the integration of ensemble learning techniques to further boost diagnostic accuracy. Additionally, optimizing models for real-time processing and deployment in low-resource environments remains a critical avenue for development. The findings call for increased collaboration between machine learning practitioners and healthcare professionals to co-design systems that align technological capabilities with medical needs. Continued investments in research and development are imperative to bridge the gap between technological advancements and their practical implementation in global health initiatives.
 Copyright © 2025 by the Author(s). Published by Institute of Emerging and Computer Engineers. This article is an open access article distributed under the terms and conditions of the Creative Commons Attribution (CC BY) license (https://creativecommons.org/licenses/by/4.0/), which permits use, sharing, adaptation, distribution and reproduction in any medium or format, as long as you give appropriate credit to the original author(s) and the source, provide a link to the Creative Commons licence, and indicate if changes were made.
 IECE Journal of Image Analysis and Processing
ISSN: request pending (Online)
Email: [email protected]

Portico
All published articles are preserved here permanently:
https://www.portico.org/publishers/iece/