


Sustainable Intelligent Infrastructure
ISSN: request pending (Online) | ISSN: request pending (Print)
Email: [email protected]

Landfills are a necessary evil in our modern world. While they provide a place to dispose of waste, preventing harmful contaminants from leaking into the surrounding environment is paramount. This is where landfill liners come in – acting as the frontline defense against pollution. These crucial components are essentially barriers at the base and sides of landfills, designed to capture and retain pollutants before they can migrate into the soil and groundwater.
The effectiveness of these liners hinges on their ability to act like microscopic sponges, soaking up and holding onto pollutants. But how can we truly understand how well a material performs at this level? Recent advancements in material characterization techniques have provided researchers with powerful tools to delve deeper than ever before. These techniques allow us to peer into the very heart of a material, revealing its intricate structure and composition at the microscopic level [1, 5].
This study takes advantage of these cutting-edge techniques to unlock the secrets of landfill liner performance. The core focus lies in understanding how the microscopic properties of a material translate into its ability to function effectively at the larger, macroscopic scale. The underlying principle is fascinating: the way a material is structured at the microscopic level – the arrangement of its atoms and the presence of different elements – has a profound impact on how it interacts with pollutants at the macroscopic level, which ultimately determines a liner's success in safeguarding the environment [3]. Although the adsorption capacities of various soil types have been compared [2], a detailed microstructural comparison of how these soils interact with contaminants and additives is lacking. This study addresses this gap by directly comparing the surface morphology and elemental composition of Red soil and Black cotton soil under identical experimental conditions, while macroscopic studies have shown the potential of using soil-additive mixtures for landfill liners, the microstructural mechanisms governing contaminant adsorption remain poorly understood [4]. Therefore, the objectives of this research were to: (1) characterize the microstructural changes in red and black cotton soils amended with cement and fly ash following exposure to copper and chromium using SEM and EDS; (2) compare the adsorption capabilities of these soil-additive combinations at the microscopic level; and (3) validate batch adsorption results with microstructural evidence, demonstrating the feasibility of utilizing these materials for practical landfill liner applications [6, 7].
Furthermore, the data obtained from leaching tests provides a basis for predicting long-term performance, enabling engineers to design robust and reliable containment systems. Future research should focus on field-scale validation and optimization of these soil-additive mixtures for broader implementation.
Preparing Leached Soil Samples for Microscopic Examination
This section outlines the steps involved in preparing soil samples for Scanning Electron Microscopy (SEM) and Energy-Dispersive Spectroscopy (EDS) analysis, following their exposure to contaminants through leaching tests.
| No. | Adsorption | Ranking |
| 1 | Cu adsorption capacity on red soil and its additives | RS3C > RS5F > RS6L > RS3L > RS4F > RS3F > RS2F > RS1C > RS1F > RS. |
| 3 | Cr Adsorption Capacity on Red Soil and its additives | RS5F > RS4F > RS3F > RS1F > RS2F > RS3L > RS6L > RS1C > RS3C > RS. |
| 4 | Cu Adsorption Capacity on Black Cotton Soil and its additives | BCS3C > BCS6L > BCS3L > BCS5F > BCS4F > BCS3F > BCS2F > BCS1F > BCS1C > BCS. |
| 6 | Cr Adsorption Capacity on Black Cotton Soil and its additives | BCS5F > BCS1F > BCS6L > BCS4F > BCS3F > BCS2F > BCS3L > BCS3C > BCS1C > BCS. |
The starting point involves soil samples spiked with specific contaminants, mimicking the presence of pollutants in a landfill environment.
These samples then undergo a leaching test following the guidelines set by ASTM D3987-85 standard. This test simulates the process of water filtering through the soil and potentially carrying away contaminants. The leaching process itself lasts for 18 hours, followed by an additional 8-hour buffering period to ensure complete interaction between the contaminant and the soil.
After leaching, the filtered soil solution (the extracted liquid) is set aside, and the remaining soil becomes the focus for microscopic analysis.
To establish a baseline for comparison, a sample of virgin soil (unspiked with contaminants) is also prepared for SEM and EDS analysis, due to brevity and economic concerns single samples of each combination was selected based on experimental sorption data and only specimens which were critical for this study were selected. The absence of heavy metal peaks in the EDS data suggests minimal background concentration in the red soil, which aligns with the inclusion/exclusion criteria of clean, unpolluted soil, as defined by [8] and studies by [9] have also reported similar low background levels of heavy metals in uncontaminated soils.
Soil particles are generally non-conductive, which can pose challenges for SEM imaging. To overcome this hurdle, a thin layer of metal coating is applied to the mounted samples.
Platinum is the preferred metal coating material for this purpose. The coating process is carried out using a specialized metal coating machine that ensures a uniform layer.
The coating time is carefully controlled at 120 seconds, and the vacuum pressure within the machine is maintained below 5 Pascals (a unit of pressure) to achieve optimal results.
With the samples prepared, they are ready for examination using a JEOL JSM 6360-A model SEM instrument. This powerful microscope boasts the capability of magnifying the samples by X500, X1000, and X2000, allowing for a detailed exploration of the soil structure at various scales.
The accelerating voltage employed during the analysis is 20 kV, providing sufficient energy for the electron beam to interact with the sample and generate high-quality images.
In addition to SEM imaging, simultaneously through an inbuilt software EDS analysis is also performed on the samples. This technique allows for the identification and quantification of the elements present within the soil particles. By analyzing the elemental composition, researchers can gain valuable insights into the potential interactions between the soil and the contaminant.
Finally, a specific technique called area analysis is employed. This allows researchers to pinpoint specific regions of the sample and determine the precise elemental composition within those areas. This provides a more comprehensive understanding of the distribution of elements within the soil particles.
In order to have a better comparison between macroscopic and microstructural studies batch sorption tests were performed for all the combinations of materials and a consolidated data giving the ranking based on their sorption capacity is enumerated in the Table 1, due to brevity and optimizing among all the combinations the most conspicuous mixture was sent for microstructural analysis.
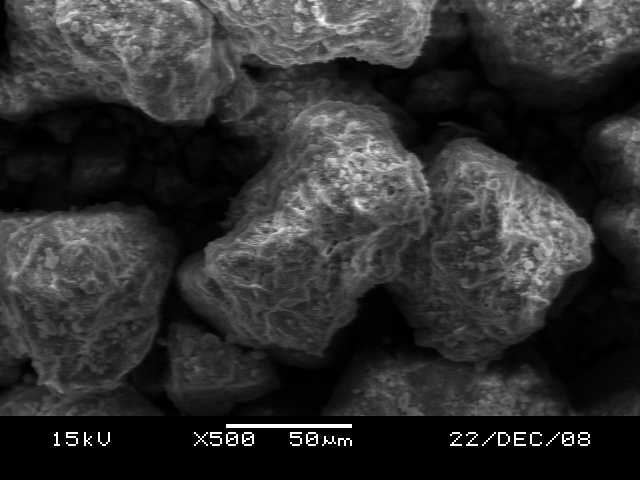
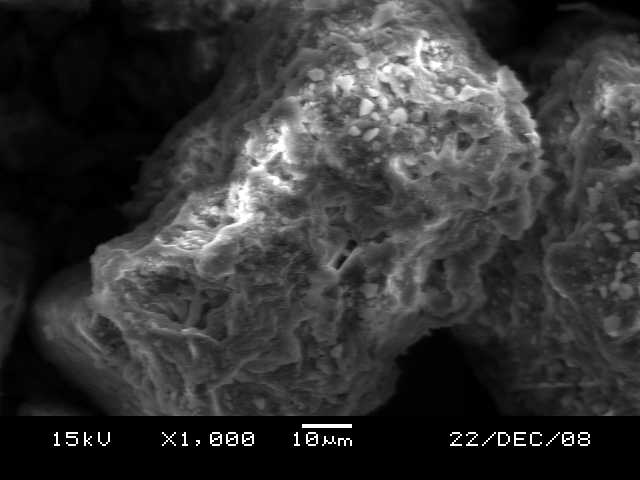
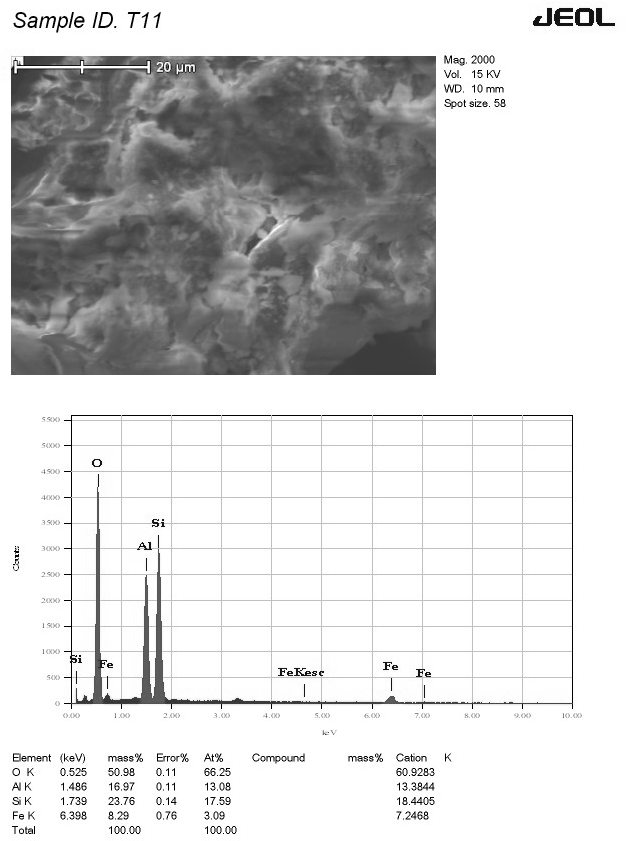
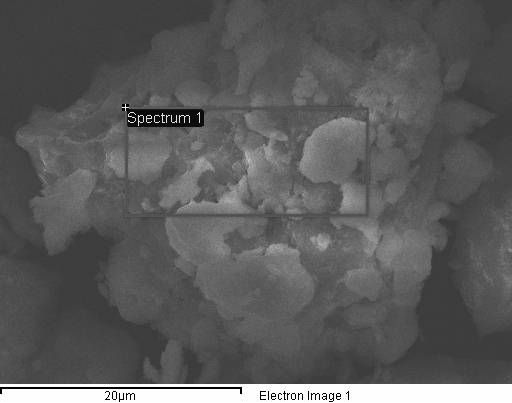
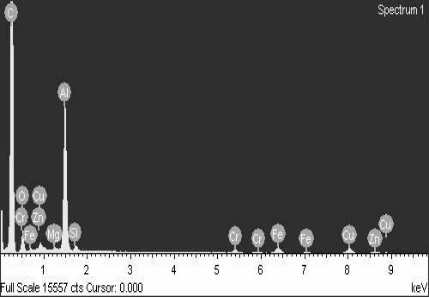
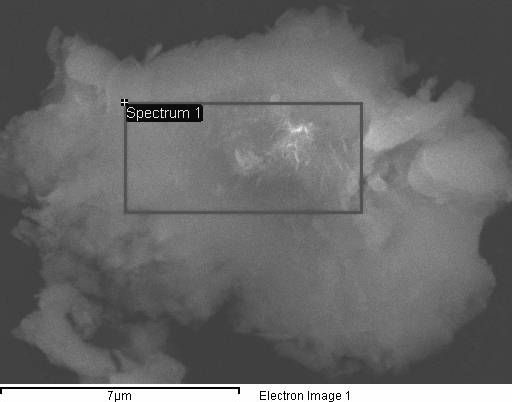
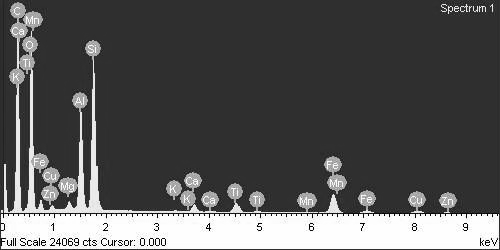
SEM analysis of red soil, as shown in Figure 1, revealed a cluster of crystalline elements with air pockets embedded in a clay matrix. These features suggest potential clumping or aggregation reactions within the soil. The corresponding EDS analysis, as shown in Figure 2, identified quartz, alumina, and iron as the primary elements. Notably, the presence of iron bestows the characteristic red color of the soil. The presence of regular, porous, sponge-like particles suggests the presence of aluminosilicate, a major constituent of zeolites, known for their adsorptive properties. The EDS data showed a distinct oxygen peak, followed by peaks for silica, alumina, and iron. The absence of heavy metal peaks in the EDS data suggests minimal background concentration in the red soil, which aligns with the inclusion/exclusion criteria of clean, unpolluted soil. Additionally, no peaks for copper and chromium were observed, which aligns with the lower specific surface area (44 m2/g) and CEC value (18.5 meq/100g) of red soil compared to black cotton soil (63 m2/g and 41.82 meq/100g), suggesting potentially lower metal ion adsorption for red soil.
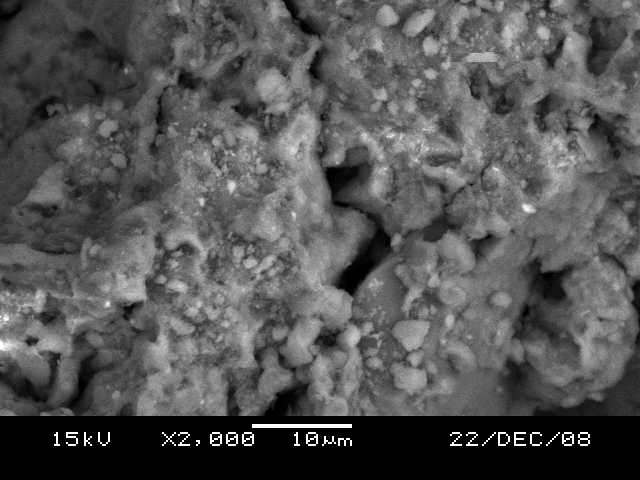
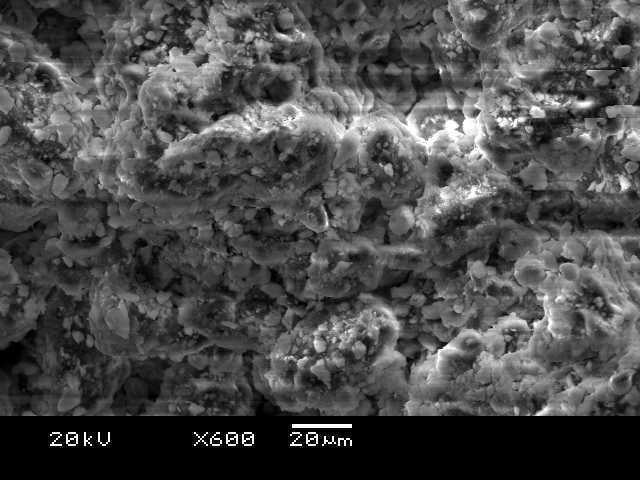
Black cotton soil analysis revealed promising characteristics for contaminant adsorption, as shown in Figure 3. Scanning electron microscopy (SEM) showed aluminosilicate crystals coated in a clay-like substance, indicating a higher clay content compared to red soil. Energy-dispersive spectroscopy (EDS) confirmed this by detecting carbon, a marker for organic matter. Additionally, EDS identified significant amounts of alumina, silica, and iron, further supporting the selection of black cotton soil.
The presence of a clayey mass around the silica crystals suggests a higher proportion of silt particles, contributing to the soil's larger specific surface area – a key factor for adsorption. Interestingly, the EDS data also revealed trace amounts of copper, zinc, and chromium, likely naturally occurring in the soil. While these background levels cannot be quantified by EDS, their presence hints at the material's potential to retain heavy metal ions, aligning with the positive results observed in the prior batch adsorption and leaching experiments.
When copper was added to the red soil, the SEM image in Figure 4 revealed clumping of particles (aggregation). This suggests that chemical reactions, such as precipitation, adsorption, and ion exchange, took place between the copper and the soil components. While the batch adsorption studies confirmed copper uptake by the red soil, the extent of adsorption was lower compared to other tested materials.
Microscopic analysis using SEM, as shown in Figure 4, revealed significant changes in the red soil after adding copper and cement. The image shows particles clumping together (aggregation) and even fusing, likely due to chemical reactions triggered by the cement. This suggests a decrease in pore space within the material, potentially leading to increased strength. Interestingly, this observation aligns with the findings from the batch adsorption studies, where copper adsorption was highest with the addition of cement. The fused mixture also appears uniform in texture, hinting at its stability and the potential for copper entrapment within the cement matrix.
The corresponding EDS analysis, as shown in Figure 6, further supports these observations. Silicon and aluminum are the most prominent elements detected, followed by oxygen. Importantly, copper is also clearly present in the EDS data, confirming the copper adsorption observed in the larger-scale experiments. The strong silica peak suggests that cement hydrolysis has indeed occurred, resulting in the formation of stable cement compounds. This is further corroborated by the presence of alumina, silica, ferrous, and oxide complexes identified by EDS.
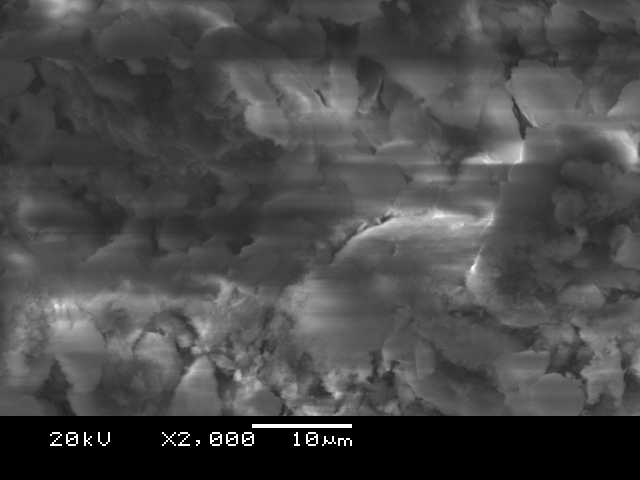
Red soil with added copper, as shown in Figures 4 and 5, exhibited significant changes under the scanning electron microscope (SEM) at 2000x magnification. The presence of cement, acting as a binding agent, caused particles to clump together (aggregate) and even fuse. This suggests a decrease in pore space within the material, potentially leading to increased strength. Interestingly, this observation aligns with the results from the batch adsorption studies, where copper adsorption was highest with the addition of cement. The fused mixture also displays a uniform texture, hinting at its stability and the potential for copper to become trapped within the cement matrix.
Energy-dispersive spectroscopy (EDS) analysis, as shown in Figure 6, further supports these findings. Silicon and aluminum were the most abundant elements detected, followed by oxygen. Crucially, copper was also clearly present in the EDS data, confirming the copper adsorption observed in the larger-scale experiments. The prominent silica peak suggests that cement hydrolysis, a chemical reaction involving water, has indeed occurred. This process likely led to the formation of stable cement compounds, further supported by the presence of alumina, silica, ferrous, and oxide complexes identified by EDS.
The addition of copper and 1% cement to black cotton soil resulted in visible particle clumping (agglomeration), as shown in Figure 7. This clumping likely occurred due to a combination of chemical reactions triggered by copper, such as precipitation, adsorption, and ion exchange. Similar to red soil, the cement seems to have caused particles to stick together (aggregate) and even fuse, potentially leading to a decrease in pore space and a stronger overall mixture.
The corresponding EDS analysis, as shown in Figure 7, reveals several key points. First, it confirms copper adsorption in the soil. Additionally, the presence of carbon, the highest peak, suggests a higher organic matter content in black cotton soil compared to red soil. Other prominent elements include silica, manganese, calcium, and alumina. Notably, the presence of various ions like zinc (Zn), copper (Cu), iron (Fe), and titanium (Ti) further supports the notion that black cotton soil has a higher capacity for adsorption.

Microscopic examination through SEM, as shown in Figures 8 and 9, reveals fascinating details about the red soil and fly ash mixture used for chromium adsorption. Magnified 1000 times, the image showcases a diverse landscape of fly ash particles. Some appear as hollow spheres (cenospheres), while others resemble spheres containing smaller spheres (plerospheres). Interestingly, irregular, porous structures with a sponge-like appearance are also visible, alongside microcrystals scattered across the surfaces. These sponge-like features bear a striking resemblance to aluminosilicate, a well-known material used for removing metals from various solutions. This resemblance hints at the potential of combining red soil and fly ash to create a powerful composite adsorbent for capturing metal ions like chromium.
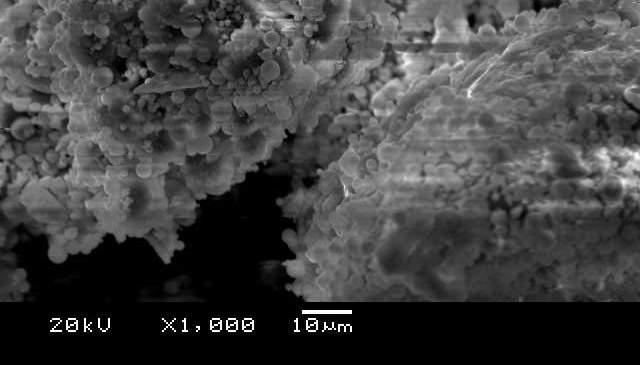
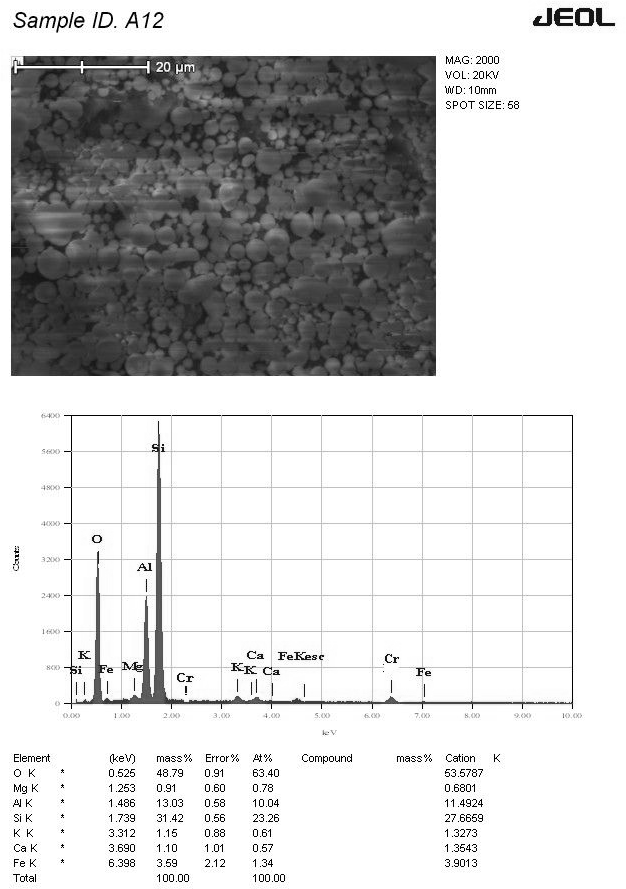
Figure 9 takes this analysis a step further, showcasing both the SEM image and the corresponding EDS data for the red soil and fly ash mixture with chromium. The EDS analysis confirms the presence of mullite, a mineral commonly found in fly ash, alongside quartz and the typical plerospheres composed of elements like silicon (Si), aluminum (Al), calcium (Ca), and iron (Fe). Notably, the image also reveals particle agglomeration, suggesting interactions between the components and potential chromium adsorption following its addition. This observation aligns perfectly with the findings from the larger-scale batch adsorption and leaching studies, which demonstrated a significant increase in chromium adsorption when fly ash was added to the red soil.
The mechanism behind this enhanced adsorption is further elucidated by the EDS data in Figure 9. Distinct peaks for silicon (Si), aluminum (Al), and iron (Fe) are evident, alongside a smaller but noticeable peak for chromium (Cr). While the data cannot quantify the exact amount of chromium adsorbed, it provides strong confirmation that the positive effects observed at the macroscopic level (increased adsorption in the batch studies) translate to the microscopic level as well. This is further solidified by comparing Figures 2 and 9. The absence of a chromium peak in the EDS data for pure red soil, as shown in Figure 2, stands in stark contrast to the distinct chromium peak observed in the mixture with fly ash, as shown in Figure 9. This comparison serves as compelling evidence for chromium adsorption by the red soil and fly ash composite.
Taking a closer look at the black cotton soil with fly ash mixture, as shown in Figure 10, magnified 250 times using SEM, reveals some fascinating details. The fly ash particles appear quite similar to those observed in the red soil mixture, as shown in Figure 8. This suggests a consistent composition of the fly ash used in both experiments.
Energy-dispersive spectroscopy (EDS) analysis comes to the rescue again, providing valuable information about the elemental makeup of this mixture. Just like with the red soil mixture, EDS confirms the presence of mullite, a mineral commonly found in fly ash, alongside quartz and the typical plerospheres. These plerospheres are essentially spheres containing smaller spheres and are composed of elements like silicon (Si), aluminum (Al), calcium (Ca), and iron (Fe). Interestingly, the SEM image also hints at particle agglomeration. This clumping could be a sign of interactions between the components, potentially due to chromium adsorption.
The real strength of this analysis lies in how it reinforces the observations made at the larger scale (macroscopic level) through batch adsorption and leaching studies. The EDS data in Figure 10 provides strong supporting evidence for chromium adsorption. Distinct peaks for aluminum (Al), silicon (Si), and iron (Fe) are evident, alongside a clear peak for chromium (Cr). This signifies the presence of chromium within the mixture.
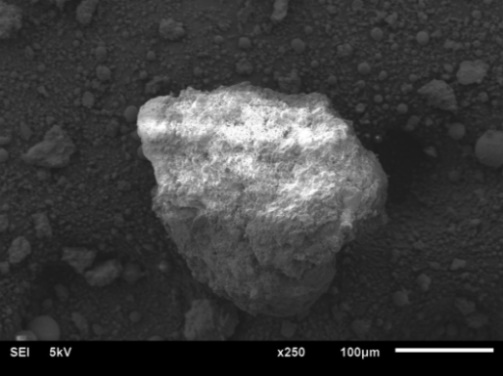
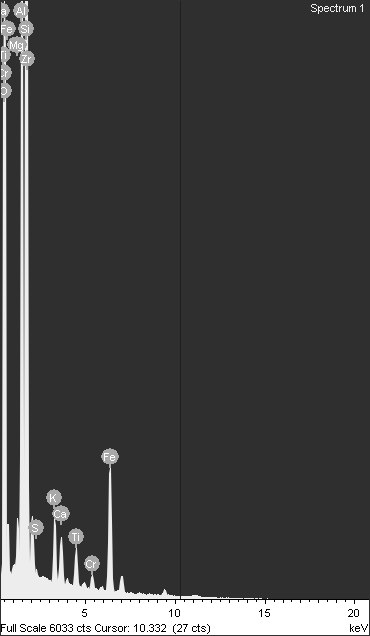
But this doesn't just tell us chromium is present; it goes a step further. Figure 10(a) showcases a magnified view of a single cenosphere (a hollow fly ash particle) from the mixture. Look closely, and you might see what appear to be chromium ions attached to its surface! This visual evidence provides compelling support for the idea of chromium adsorption onto the fly ash component within the black cotton soil mixture.
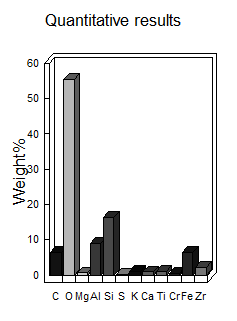
While the EDS data cannot provide absolute quantities of adsorbed chromium, it does offer valuable insights into the overall elemental composition. Figure 10(b) delves into this quantitative aspect, revealing the weight percentages of various elements present in the mixture. It's important to note that this data goes beyond the scope of this excerpt, but it offers additional information for a more comprehensive analysis. The observed metal adsorption can be attributed to a combination of chemical processes involving cement and fly ash. Cement hydration increased soil pH, promoting the precipitation of Cu(OH)2 and Cr(OH)3, while the formation of C-S-H gels provided surface complexation sites and ion exchange opportunities. Fly ash contributed through pozzolanic reactions, forming aluminosilicate gels that immobilized metals, and its high surface area facilitated adsorption. Furthermore, fly ash likely reduced mobile Cr(VI) to less mobile Cr(III), enhancing chromium retention. EDS data, showing elemental composition and metal distribution, supports these reaction pathways, with observed microstructural changes like particle aggregation correlating with these chemical interactions. These findings, when discussed alongside any observed pH changes and supported by relevant literature, provide a comprehensive understanding of the mechanisms driving metal adsorption in the studied soil-additive mixtures. Microstructural analysis revealed that cement-induced particle aggregation and fusion enhance liner mechanical stability, reducing cracking and permeability, while fly ash promotes long-term chemical stability by forming resistant aluminosilicate gels and reducing mobile Cr(VI). These microscopic improvements, validated by leaching tests, translate to practical performance gains in landfill scenarios, including enhanced contaminant retention, reduced leachate migration, and increased liner longevity, offering a cost-effective and environmentally sound waste containment solution.
Microscopic techniques like Scanning Electron Microscopy (SEM) and Energy-Dispersive Spectroscopy (EDS) shed light on the effectiveness of various additives (cement and fly ash) in enhancing the ability of red and black cotton soil to capture heavy metals (copper and chromium). Here's a breakdown of the key takeaways:
Boosting Metal Adsorption with Additives: Both SEM and EDS analyses provided compelling evidence that cement and fly ash significantly improve the soil's capacity to adsorb metals. This translates to a higher efficiency in capturing and retaining copper and chromium within the landfill liner system.
Black Cotton Soil: The Champion Adsorber: Interestingly, the study revealed black cotton soil to be a superior adsorbent compared to red soil. This observation is supported by the stronger metal peaks detected in the EDS data for black cotton soil. The higher organic matter content in black cotton soil is believed to be a contributing factor to its enhanced adsorption potential.
Cement: Strength and Stability: The addition of cement not only promotes metal adsorption but also appears to strengthen the overall soil-additive mixture. SEM images showed evidence of particle clumping and even fusion, suggesting a more robust structure. Furthermore, the corresponding EDS data indicated the formation of stabilizing cement compounds, potentially contributing to the long-term integrity of the liner.
Fly Ash: The Aluminosilicate Advantage: The presence of aluminosilicate particles within fly ash emerged as another key factor influencing metal adsorption, particularly for chromium. EDS analysis confirmed the presence of iron and alumina in the fly ash, which are known to play a crucial role in reduction mechanisms observed at the larger scale (macroscopic) experiments. These reduction mechanisms likely convert chromium into a more stable form, facilitating its capture by the soil-additive mixture.
Bridging the Gap Between Scales: The beauty of this microscopic analysis lies in its ability to validate the observations made during the larger-scale adsorption and leaching experiments. The absence of metal peaks in the EDS data for pure soil samples serves as a baseline. Conversely, the clear presence of metal peaks in the data for samples spiked with copper and chromium confirms adsorption at the microscopic level. This alignment between microscopic and macroscopic findings strengthens the overall conclusions and provides a more complete picture of the effectiveness of these soil-additive combinations for landfill liner applications.
 Copyright © 2025 by the Author(s). Published by Institute of Emerging and Computer Engineers. This article is an open access article distributed under the terms and conditions of the Creative Commons Attribution (CC BY) license (https://creativecommons.org/licenses/by/4.0/), which permits use, sharing, adaptation, distribution and reproduction in any medium or format, as long as you give appropriate credit to the original author(s) and the source, provide a link to the Creative Commons licence, and indicate if changes were made.
 Sustainable Intelligent Infrastructure
ISSN: request pending (Online) | ISSN: request pending (Print)
Email: [email protected]

Portico
All published articles are preserved here permanently:
https://www.portico.org/publishers/iece/