
Chinese Journal of Information Fusion
ISSN: 2998-3371 (Online) | ISSN: 2998-3363 (Print)
Email: [email protected]

In the daily training of military fighter pilots, complex flight maneuvers training is a crucial and indispensable subject. Its purpose is to enable pilots to rapidly adjust the aircraft’s flight status within a short period, thereby enhancing their ability to respond to various challenges in complex environments [1]. Quantifying the anomaly levels of these flight maneuvers is vital for evaluating their quality. It plays a key role in ensuring flight safety, optimizing training programs, and improving pilots’ operational skills and combat capabilities [2].Traditional evaluation methods for anomaly levels depend on subjective observations and manual records, which are inefficient and lack precision. With the increase of novice pilots, these limitations become more apparent, failing to meet modern flight training requirements. Therefore, developing maneuver anomaly level quantification evaluation methods to achieve automated evaluation of flight training quality holds significant military value and practical significance.
The quantification of flight maneuver anomaly levels involves two primary aspects: the recognition of complex flight maneuver and the quantification of anomaly level based on the recognition results. Currently, both domestic and international researchers have conducted some research in these two areas. In terms of complex flight maneuver recognition, existing methods can be categorized into three types: pattern matching-based methods, expert system-based methods, and machine learning-based methods. Traditional pattern matching-based methods typically rely on predefined similarity metrics, such as Dynamic Time Warping [3] (DTW) and its improved algorithms [4, 5, 6]. Then, subsequences with similarity exceeding a specific threshold with template sequences are labeled as the same flight maneuver category. This method solves the classification problem of non-equally long time series data and does not rely on domain knowledge. However, it requires calculating the similarity with all known flight maneuvers, resulting in low algorithm efficiency. Moreover, this method is difficult to distinguish between complex flight maneuver s with high similarity and requires manual adjustment of the threshold. Expert system-based methods depend on the prior knowledge of domain experts to construct an artificial rule knowledge base and achieve flight maneuver recognition through pattern matching techniques [7, 8]. These methods demonstrate high efficiency and accuracy in recognizing basic flight maneuvers. However, the construction and maintenance of the knowledge base require high manual costs, and each model is usually only suitable for specific types of aircraft or flight tasks, limiting its generalizability in practical applications. To address these challenges, machine learning-based methods have emerged and shown significant advantages, such as decision trees, support vector machines [9], hidden Markov models, and naive Bayes models [10]. These shallow learning methods are suitable for handling linearly separable or simply nonlinear problems and have achieved satisfactory results in inferring the details of flight maneuvers. Furthermore, due to the high dimensionality, strong coupling, and non-linear characteristics of multi-dimensional flight maneuver sequence data, shallow learning methods struggle to capture the significant distinguishing features of complex flight maneuvers, thereby further limiting their effectiveness in recognizing complex flight maneuvers. Therefore, exploring more efficient and generalizable recognition methods is an important direction for current research.
In the aspect of quantifying flight maneuver anomaly levels, current research primarily focuses on the anomaly detection of flight parameter data, covering the identification of point anomalies, sequence anomalies, and pattern anomalies [11, 12, 13, 14]. For the detection of anomalies in overall flight trajectories, the main methods include rule-based, model-based, and deep learning-based anomaly level evaluation methods. Rule-based methods quantify the anomaly levels of detected flight maneuvers through predefined rules and standards [15]. While this approach is straightforward and intuitive, its effectiveness is heavily reliant on the formulation of the rules, making it difficult to adapt to complex and variable flight environments. In contrast, model-based methods involve the establishment of mathematical models representing aircraft and pilot operations, utilizing simulation techniques to evaluate abnormal situations in flight maneuvers [16]. Although this approach can accurately simulate the flight process, the complexity involved in model construction and simulation calculations limits its generalizability and applicability across different scenarios. Deep learning-based methods, on the other hand, leverage deep neural network models trained on large datasets to learn and extract anomaly patterns, achieving automated anomaly detection and evaluation [17, 18, 19]. Despite the promising application potential of this method, the acquisition of labeled data in supervised learning and the setting of anomaly thresholds in unsupervised learning pose certain limitations to its practical application.
To address the aforementioned challenges, this paper proposes a novel method for the automatic quantification of anomaly levels in complex flight maneuvers by fusing multi-sensor data. This method consists of two primary stages: complex flight maneuver recognition and anomaly level quantification. In the first stage, we tackle the issue of insufficient accuracy in recognizing complex flight maneuvers by employing a one-dimensional ResNet18 [20] (1D-ResNet) neural network enhanced with a dual attention module (DAM). In the second stage, the flight parameter sequence samples of flight maneuvers are normalized in time to ensure consistent sequence lengths. Then, by clustering similar flight maneuvers, a standard flight maneuver benchmark library is constructed for different categories. Next, the dynamic time warping algorithm is used to calculate the similarity between the test flight maneuver samples and the reference set. Finally, the similarity scores are normalized to abnormality quantification scores, which is categorized into anomaly levels based on predetermined score intervals. The proposed method for quantifying anomaly levels in complex flight maneuvers effectively supports automated evaluation of flight training quality. It enhances the efficiency and accuracy of flight training quality evaluation, aligning with the requirements of modern flight training programs.
Notably, fighter aircraft can perform numerous complex flight maneuvers. For the sake of simplicity, in this paper, we selected eight typical complex flight maneuvers as the research objects, which include the following: loop, cloverleaf loop, aileron roll, immelmann turn, split-S, pull-up, push-over and circulating.
Definition 1. (Flight Maneuver Recognition, FMR). Given a flight maneuver sequence where denotes the number of time steps and denotes the number of parameters closely related to the flight state. The FMR can be regarded as given input maneuver sequence , we want to accurately predict the class label from predefined classes.
We aim to train a deep neural network classifier, which is a mapping function , where is the space of all maneuver samples and is the set of all class labels, and the class label is a discrete variable. The deep neural network classifier is trained on a training dataset and subsequently evaluated on an independent test dataset .
Definition 2. (Flight Maneuver Abnormality Quantification). Defined as a metric function that measures the similarity between the test maneuver sequence and its corresponding standard flight maneuver from the predefined categories. The anomaly quantification score (AQS) can be expressed as:
where maps the similarity score to a value between 0 and 1, indicating the degree of abnormality. A score of 0 indicates completely normal performance, while a score of 1 signifies a high degree of abnormality.
Based on the AQS, we define the anomaly level as follows:
where are predefined thresholds that divide the AQS into abnormality levels, each corresponding to a different severity of abnormality.
Accurately identifying complex flight maneuvers is crucial for quantifying flight maneuver anomaly levels. During flight, parameters such as position, velocity, acceleration, heading angle, pitch angle, and roll angle undergo dynamic changes [21]. Since different maneuvers exhibit distinct patterns in these parameter changes, effective analysis of these parameters is essential for precise recognition of complex maneuvers. Given the multi-dimensional nature of flight parameter sequences and the diversity of complex flight maneuvers, the task of flight maneuver recognition is framed as a multi-class classification problem of multi-dimensional time series data. To address this challenge, a 1D-ResNet model is employed to extract deep features of flight maneuvers. The ResNet18 [22] network, with its residual block design, effectively mitigates the issue of vanishing gradients in deep neural networks through skip connections, making it well-suited for handling the nonlinear and complex characteristics of flight data.
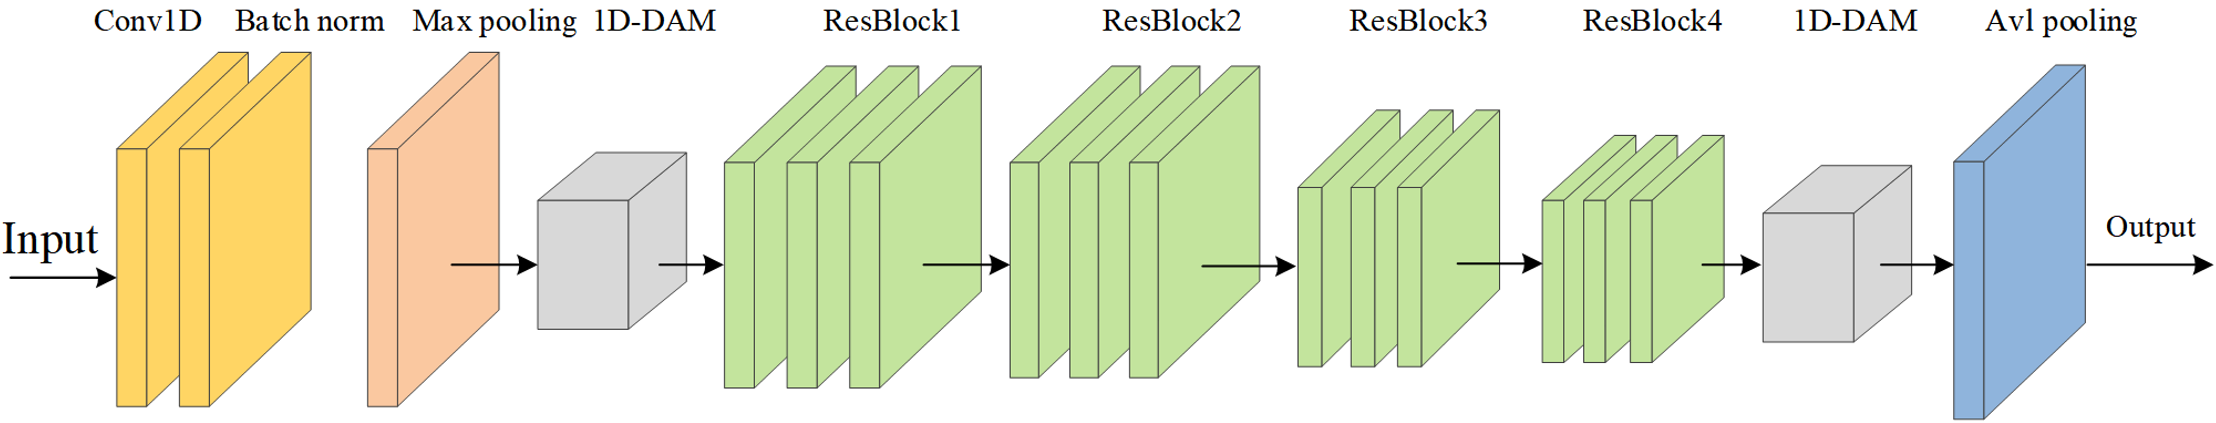
To further improve the model’s feature extraction capability, we optimized the ResNet18 architecture by proposing a novel one-dimensional dual attention ResNet18 (1D-DAMResNet). Specifically, a one-dimensional dual attention module is incorporated before the first residual block and after the last residual block. This design enhancement enables the model to better capture critical features from flight parameters. Figure 1 illustrates the architecture of the optimized network. The following sections provides a detailed explanation of the design of the one-dimensional dual attention module, along with the model’s structural parameters and optimization details.
In the task of flight maneuver recognition, the multi-dimensional flight parameter sequence exhibits dependencies over time and correlations among different features. Depending on the situation, features such as normal load factor, heading angle, or altitude become critical. To address this, we propose a strategy that incorporates an attention mechanism within the feature representation, it becomes feasible to focus on important features while suppressing irrelevant ones. Inspired by the Convolution Block Attention Module [23] (CBAM) in computer vision, we introduce a one-dimensional dual attention module (1D-DAM) that highlights meaningful features in both the channel and temporal dimensions. As shown in Figure 2, the 1D-DAM consists of two sub-modules: variable attention (VA) submodule and temporal attention (TA) submodule, which interact to capture long-range dependencies and variable interactions.
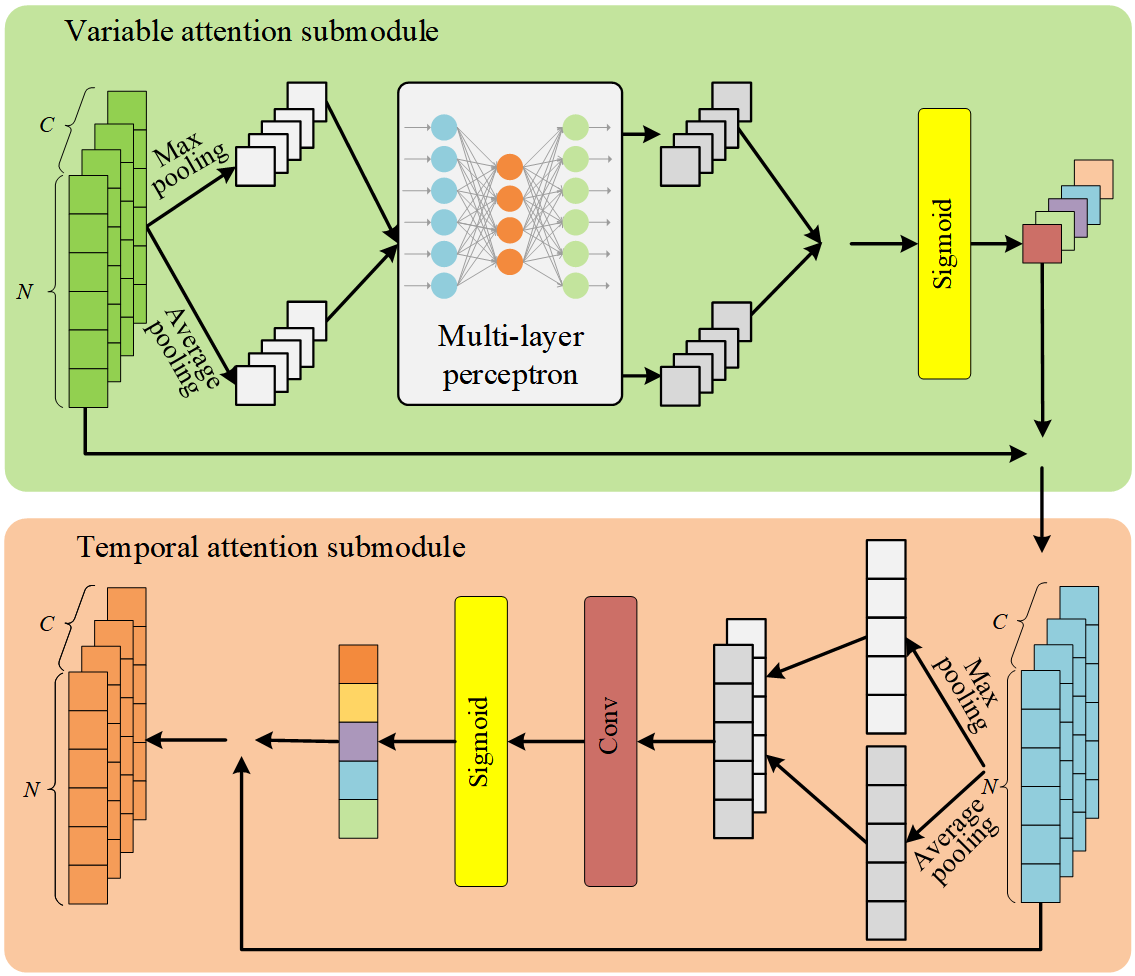
The VA submodule is designed to automatically learns the attention allocation weights for features in the variable dimension of the flight maneuver sequences. Assuming the input to the VA submodule corresponds to a feature map , where and represent the variable and temporal dimensions, respectively. To efficiently compute variable attention, global max pooling and global average pooling are applied across the temporal dimension for each feature map , generating two feature vectors: max pooling feature and average pooling feature . The element of these two vectors is calculated as follows:
where denotes the maximum element in the vector, and denotes the average of all elements in the vector.
These two vectors and are then fed into a multi-layer perceptron (MLP) with two fully connected layers: a dimensional input layer, a dimensional hidden layer, and a dimensional output layer. The goal of this MLP is to adaptively adjust the weights for each channel by first reducing the feature map channels using a reduction factor and then re-scaling them to the original size. The MLP produces two new feature vectors and , which are merged by element-wise summation and then normalized using the sigmoid function to produce the variable attention weight vector , as follows:
where and denote the GELU and sigmoid activation functions, respectively, and are convolutional mapping functions with kernel size 1.
Finally, the variable attention weight vector is element-wise multiplied with the corresponding feature maps to generate a new feature representation . The calculation formula for the feature map is as follow:
The TA submodule focuses on the crucial positions in the flight maneuver sequences along the temporal dimension. The output of the VA submodule serves as the input to this submodule. Similarly, we employ global max pooling and global average pooling operations to compute the maximum and average values across the variable dimension, resulting in two feature vectors: the max-pooled feature and the average-pooled feature . The calculation formulas for the element of these two feature vectors are as follows:
Unlike the additive strategy used in the VA submodule, these two pooled vectors are concatenated to aggregate variable dimension information, forming a feature tensor . A standard one-dimensional convolution with a kernel size of , followed by a sigmoid activation function, generates the temporal attention weight vector, as follow:
where denotes the sigmoid activation function, is a convolutional mapping function with kernel size .
Finally, the output feature map is computed by element-wise multiplication of each channel dimension feature map with the corresponding element of . This feature map simultaneously captures more critical information in both the temporal and variable domains. The calculation formula for the feature map of is as follows:
The original classification layer in the ResNet18 network consists of a global average pooling layer followed by a fully connected layer. In this paper, we introduce an improved classification layer while retaining the network structure before the global average pooling layer. The modified classification layer includes a convolutional layer, a global average pooling layer, another convolutional layer, and a final linear transformation layer. The linear transformation layer is designed to map the extracted high-dimensional features to the flight maneuver classification categories. To enhance the generalization capability of the flight maneuver recognition model, a Dropout layer is inserted between the convolutional layer and the linear transformation layer following the global average pooling layer. By integrating the attention mechanism and a modified classification layer within the ResNet18 framework, the proposed 1D-DAMResNet structure is shown in Table 1.
| Layers | Parameters | Input Size | Output Size |
|---|---|---|---|
| Conv1D | k=7 | 512 | 64256 |
| MaxPool | k=3 | 64256 | 64128 |
| 1D-DAM | / | 64128 | 64128 |
| ResBlock1 | k=3 | 64128 | 64128 |
| ResBlock2 | k=3 | 64128 | 12864 |
| ResBlock3 | k=3 | 12864 | 25632 |
| ResBlock4 | k=3 | 25632 | 51216 |
| 1D-DAM | / | 51216 | 51216 |
| Conv1D | k=1 | 51216 | 51216 |
| AvgPool | k=16 | 51216 | 512 |
| Dropout | / | 512 | 512 |
| Conv1D | k=1 | 512 | 128 |
| Dropout | / | 128 | 128 |
| Linear | / | 128 | C |
Remarks: is the number of flight parameter features; represents the kernel size; denotes the number of flight action categories.
During flight training, pilots may not always perform maneuvers according to the ideal standards, leading to significant deviations from the standard values specified in the training outline. To address this issue, this section proposes a method for quantifying anomaly levels in flight maneuvers, building upon the prior recognition of maneuver categories. The approach first applies time normalization to the flight parameter samples, ensuring consistency in data length across different categories and samples within the same category. Next, clustering is performed on maneuvers within the same category to establish the standard maneuvers sets for each class. Then, the DTW algorithm is used to calculate the similarity between the test flight maneuvers and the standard maneuver sets. and the similarity scores are normalized to obtain abnormality quantification scores. Finally, the similarity scores are normalized into abnormality quantification scores, which are categorized into different anomaly levels based on predefined score ranges. Notably, this method provides a visual representation of the deviations between the test flight maneuvers and the standard maneuvers at critical points and features. This visualization serves as a valuable tool for instructor pilots to evaluate trainees’ performance, as well as for trainees to engage in self-directed learning and training.
To quantify the anomaly levels for different categories of flight maneuvers, it is necessary to establish a standard maneuver benchmark library. This library serves as a reference standard and guides the threshold setting for subsequent scoring rules. The establishment process of the standard maneuver benchmark library is as follows.
Due to differences in pilot habits and proficiency levels, variations arise in the execution of the same flight maneuvers, particularly in terms of duration and roll direction. These differences are even more pronounced across different maneuver categories. To facilitate effective anomaly analysis, it is essential to standardize flight maneuvers. The first step in this process is to standardize the roll direction. For example, in roll maneuvers, if both left and right rolls are present, right roll angles should be converted to left roll angles, ensuring consistency in roll direction. Next, the duration of each maneuver must be normalized to a uniform length using linear interpolation or down-sampling. After duration normalization, amplitude normalization is performed to eliminate discrepancies in the scale of different feature parameters. This step is crucial for ensuring that the analysis is not affected by differences in scale. Finally, maneuvers of the same category are grouped using a clustering algorithm. Taking into account the computational complexity, time-series data characteristics, and sensitivity of the parameters, the K-Means clustering algorithm is employed. The number of clusters is set to three, and the flight maneuvers closest to the center of each cluster are selected as the standard maneuver set for that category. These standardized maneuver sets form the standard maneuver benchmark library, which serves as a reference for subsequent anomaly analysis and evaluation.
To quantify the abnormality of flight maneuvers, we first calculate the similarity between a test maneuver and all corresponding standard maneuvers using the DTW algorithm. The lowest similarity value among these comparisons is taken as the similarity score for the test sample. This process can be represented as follows:
where is the test flight maneuver sample, denotes the sample from the standard maneuver set, is the similarity between and , and represents the shortest path distance in the DTW algorithm, while is the minimum similarity value between the test sample and the standard maneuvers, effectively serving as the similarity score for the test sample.
Next, this similarity score is normalized to quantify the anomaly score, as expressed by:
where Score is the normalized similarity score, with a range of , and is abnormality quantification score for the test maneuver sample, with a range of . A higher value indicates a greater level of anomaly.
Subsequently, a mapping is established between the abnormality quantification score and anomaly levels. Specifically, according to the flight training guidelines, maneuver quality is categorized as "Poor" for scores in the range , "Good" for , and "Excellent" for . From each maneuver category, 100 samples are randomly selected along with their instructor-assigned scores. For samples with scores closest to 2.5 and 4, the abnormality quantification scores are calculated. By averaging the abnormality quantification scores of the samples nearest to 2.5 and 4, the threshold values and are determined. Based on these thresholds, the mapping between abnormality quantification scores and anomaly levels is defined as follows: a score in is classified as "Excellent," a score in is classified as "Good," and a score in is classified as "Poor." Additionally, these mappings can also be defined manually by domain experts.
To facilitate anomaly analysis, we identify the key dimensional features that flight instructors focus on for each type of maneuver. By visualizing the curves of the test maneuver and the corresponding standard maneuver for these key features, we can highlight deviations at critical points. This visualization enables instructors to diagnose the causes of anomalies more effectively.
| Flight maneuver |
|
|
|
|
Label | ||||||||
|---|---|---|---|---|---|---|---|---|---|---|---|---|---|
| Loop | 150 | 50 | 50 | M0 | 0 | ||||||||
| Cloverleaf | 150 | 50 | 50 | M1 | 1 | ||||||||
| Aileron Roll | 150 | 50 | 50 | M2 | 2 | ||||||||
| Immelmann turn | 150 | 50 | 50 | M3 | 3 | ||||||||
| Split-S | 150 | 50 | 50 | M4 | 4 | ||||||||
| Pull-up | 150 | 50 | 50 | M5 | 5 | ||||||||
| Push-over | 150 | 50 | 50 | M6 | 6 | ||||||||
| Circulating | 150 | 50 | 50 | M7 | 7 |
We used Prepar3D to generate data for eight flight maneuvers, simulating each 250 times for a total of 2,000 samples. Tacview recorded key flight parameters, including roll angle, yaw angle, pitch angle, relative altitude, vertical speed, velocity, and normal load factor.
Given that the original flight data was sampled at 30Hz, each maneuver generated a large number of data points. To reduce computational complexity, we down-sampled each sequence, dividing it into 512 intervals and randomly selecting one point from each interval. This ensured that all maneuver sequences had a uniform length of 512 data points. The final dataset consists of eight categories of complex maneuvers, with 250 samples per category. The dataset was split into training, validation, and test sets in a 6:2:2 ratio. The dataset details are presented in Table 2.
In this experiment, We used Python 3.9 and PyTorch 2.0.1 to train the model on an i9-13900HX CPU and RTX 4090 GPU. Training lasted 50 epochs with a batch size of 64, using Adam [24] optimizer and Label Smoothing Regularization [25] (LSR) loss function.
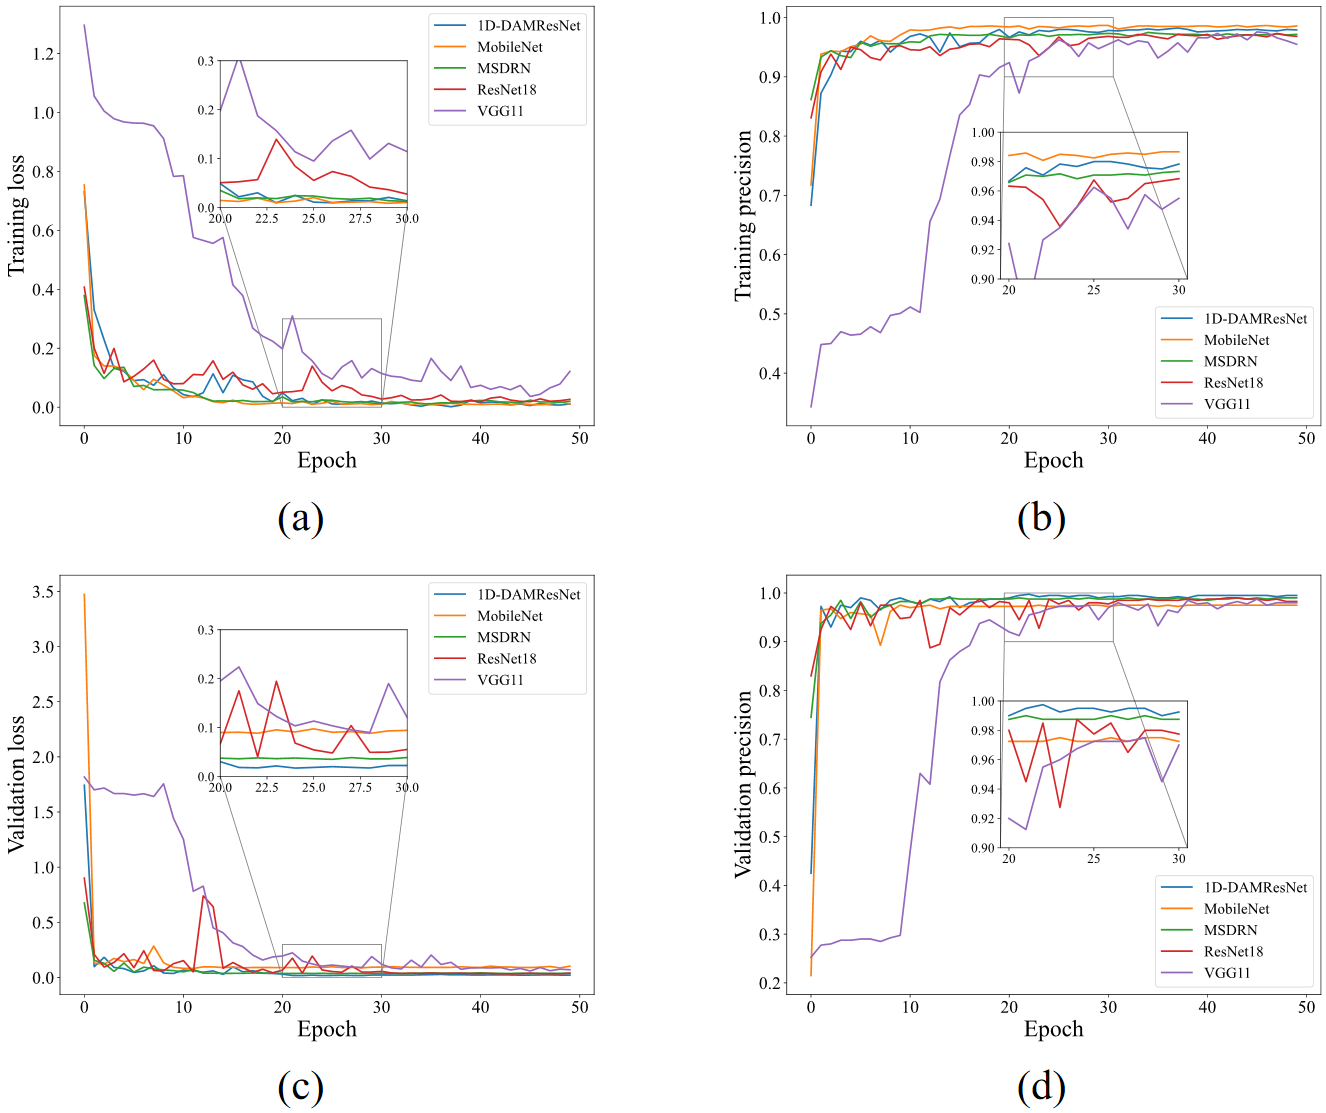
To evaluate the effectiveness and accuracy of the proposed flight maneuver recognition model, we conducted a comparative study using 1D ResNet18 [22], 1D VGG11 [26], 1D MobileNet [27], and the multi-scale feature extraction deep residual network (MSDRN) proposed in [1]. To accommodate the time-series characteristics of flight parameter data, the ResNet18, VGG11, and MobileNet models were modified by replacing their original 2D convolutional layers with 1D convolutional layers, while keeping the rest of the network architecture unchanged. For a fair comparison, all models were trained on the same dataset from scratch, without using any pre-trained weights, to eliminate the potential influence of prior knowledge on the results. Each experiment was repeated five times to mitigate the effect of randomness, and the loss and accuracy were recorded for both the training and validation sets. The average loss and accuracy from these five experiments are showed in Figure 3.
As shown in Figure 3, during the early training stages, all methods exhibited significant fluctuations in loss and precision due to the random initialization of model parameters. However, after approximately 20 epochs, all models converged, achieving low loss and high precision on both the training and validation sets, demonstrating good stability. Notably, VGG11 showed a slower convergence rate and lower precision on the validation set, both in terms of loss and precision. This is possibly due to the larger number of parameters in VGG11, which may have led to underfitting on small samples. On the other hand, MobileNet showed lower loss and higher precision on the training set but underperformed on the validation set, suggesting overfitting and reduced generalization ability. In contrast, the proposed 1D-DAMResNet model consistently achieved lower average loss and higher average precision on the validation set, with both metrics exhibiting high stability. This excellent performance can be attributed to the model’s ability to extract robust feature representations. Overall, the experimental results validated the accuracy and stability of the proposed method.
Table 3 shows the test set recognition performance of various methods, with the 1D-DAMResNet18 model achieving the highest average precision, recall, and F1 score of 99.75%. It outperforms the second-best MSDRN model by 0.25% in these metrics. The excellent performance of 1D-DAMResNet18 is due to its dual attention mechanism (DAM), which enhances feature extraction. ResNet18 and VGG11 also show high accuracy but are limited by traditional convolutional layers in capturing feature correlations. MobileNet has the lowest scores (97.50%) due to its focus on computational efficiency over accuracy. Overall, the 1D-DAMResNet model excels in recognition performance, making it a strong foundation for anomaly level quantification.
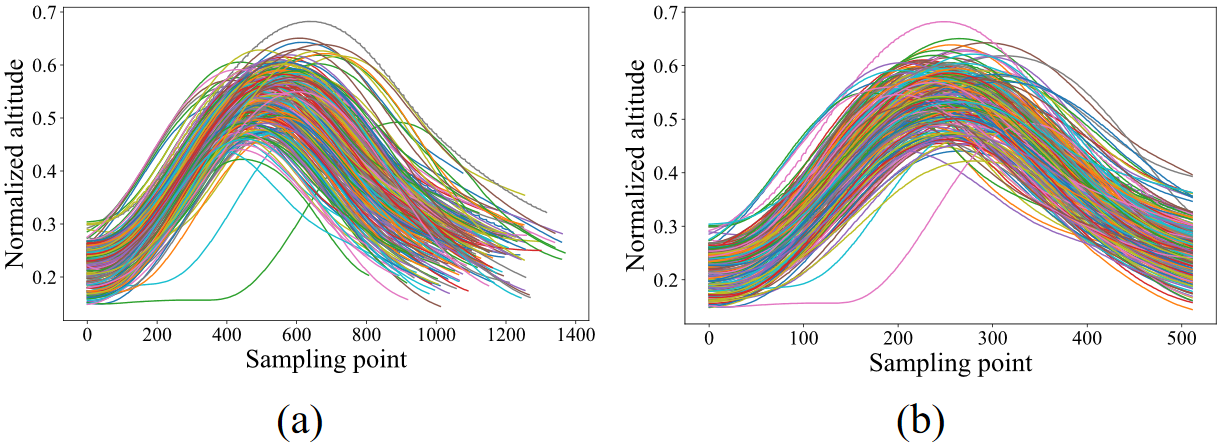
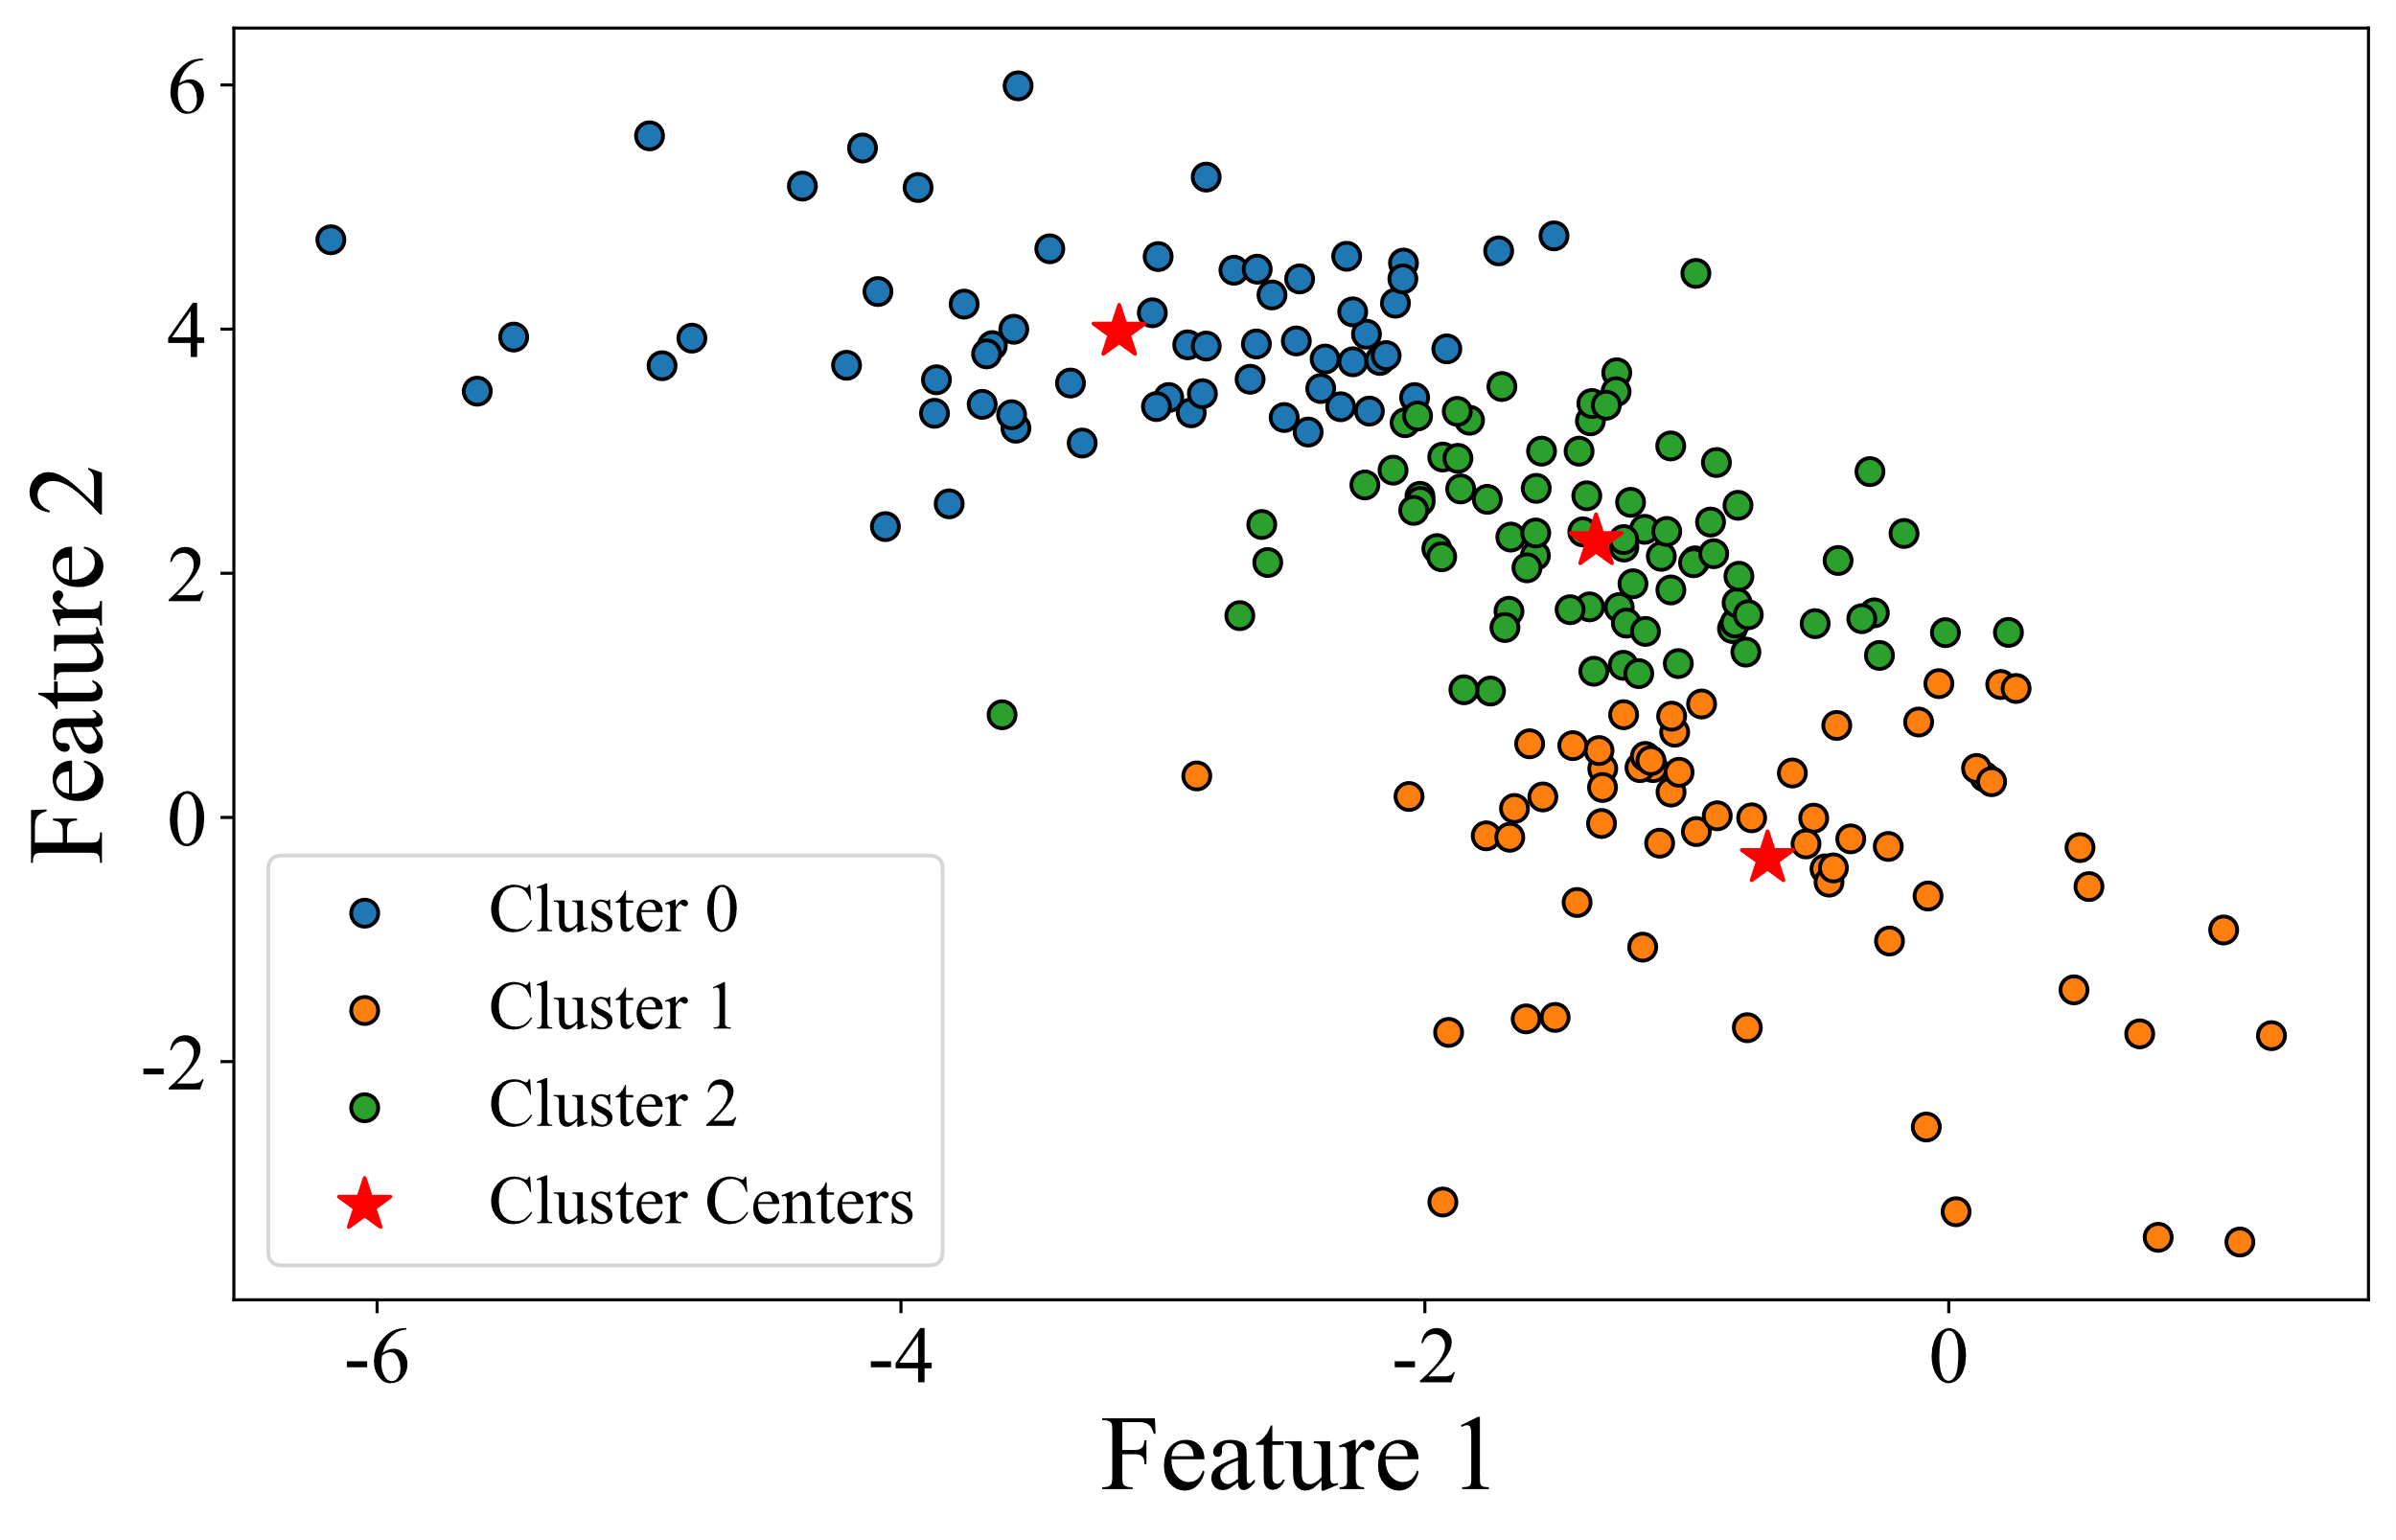
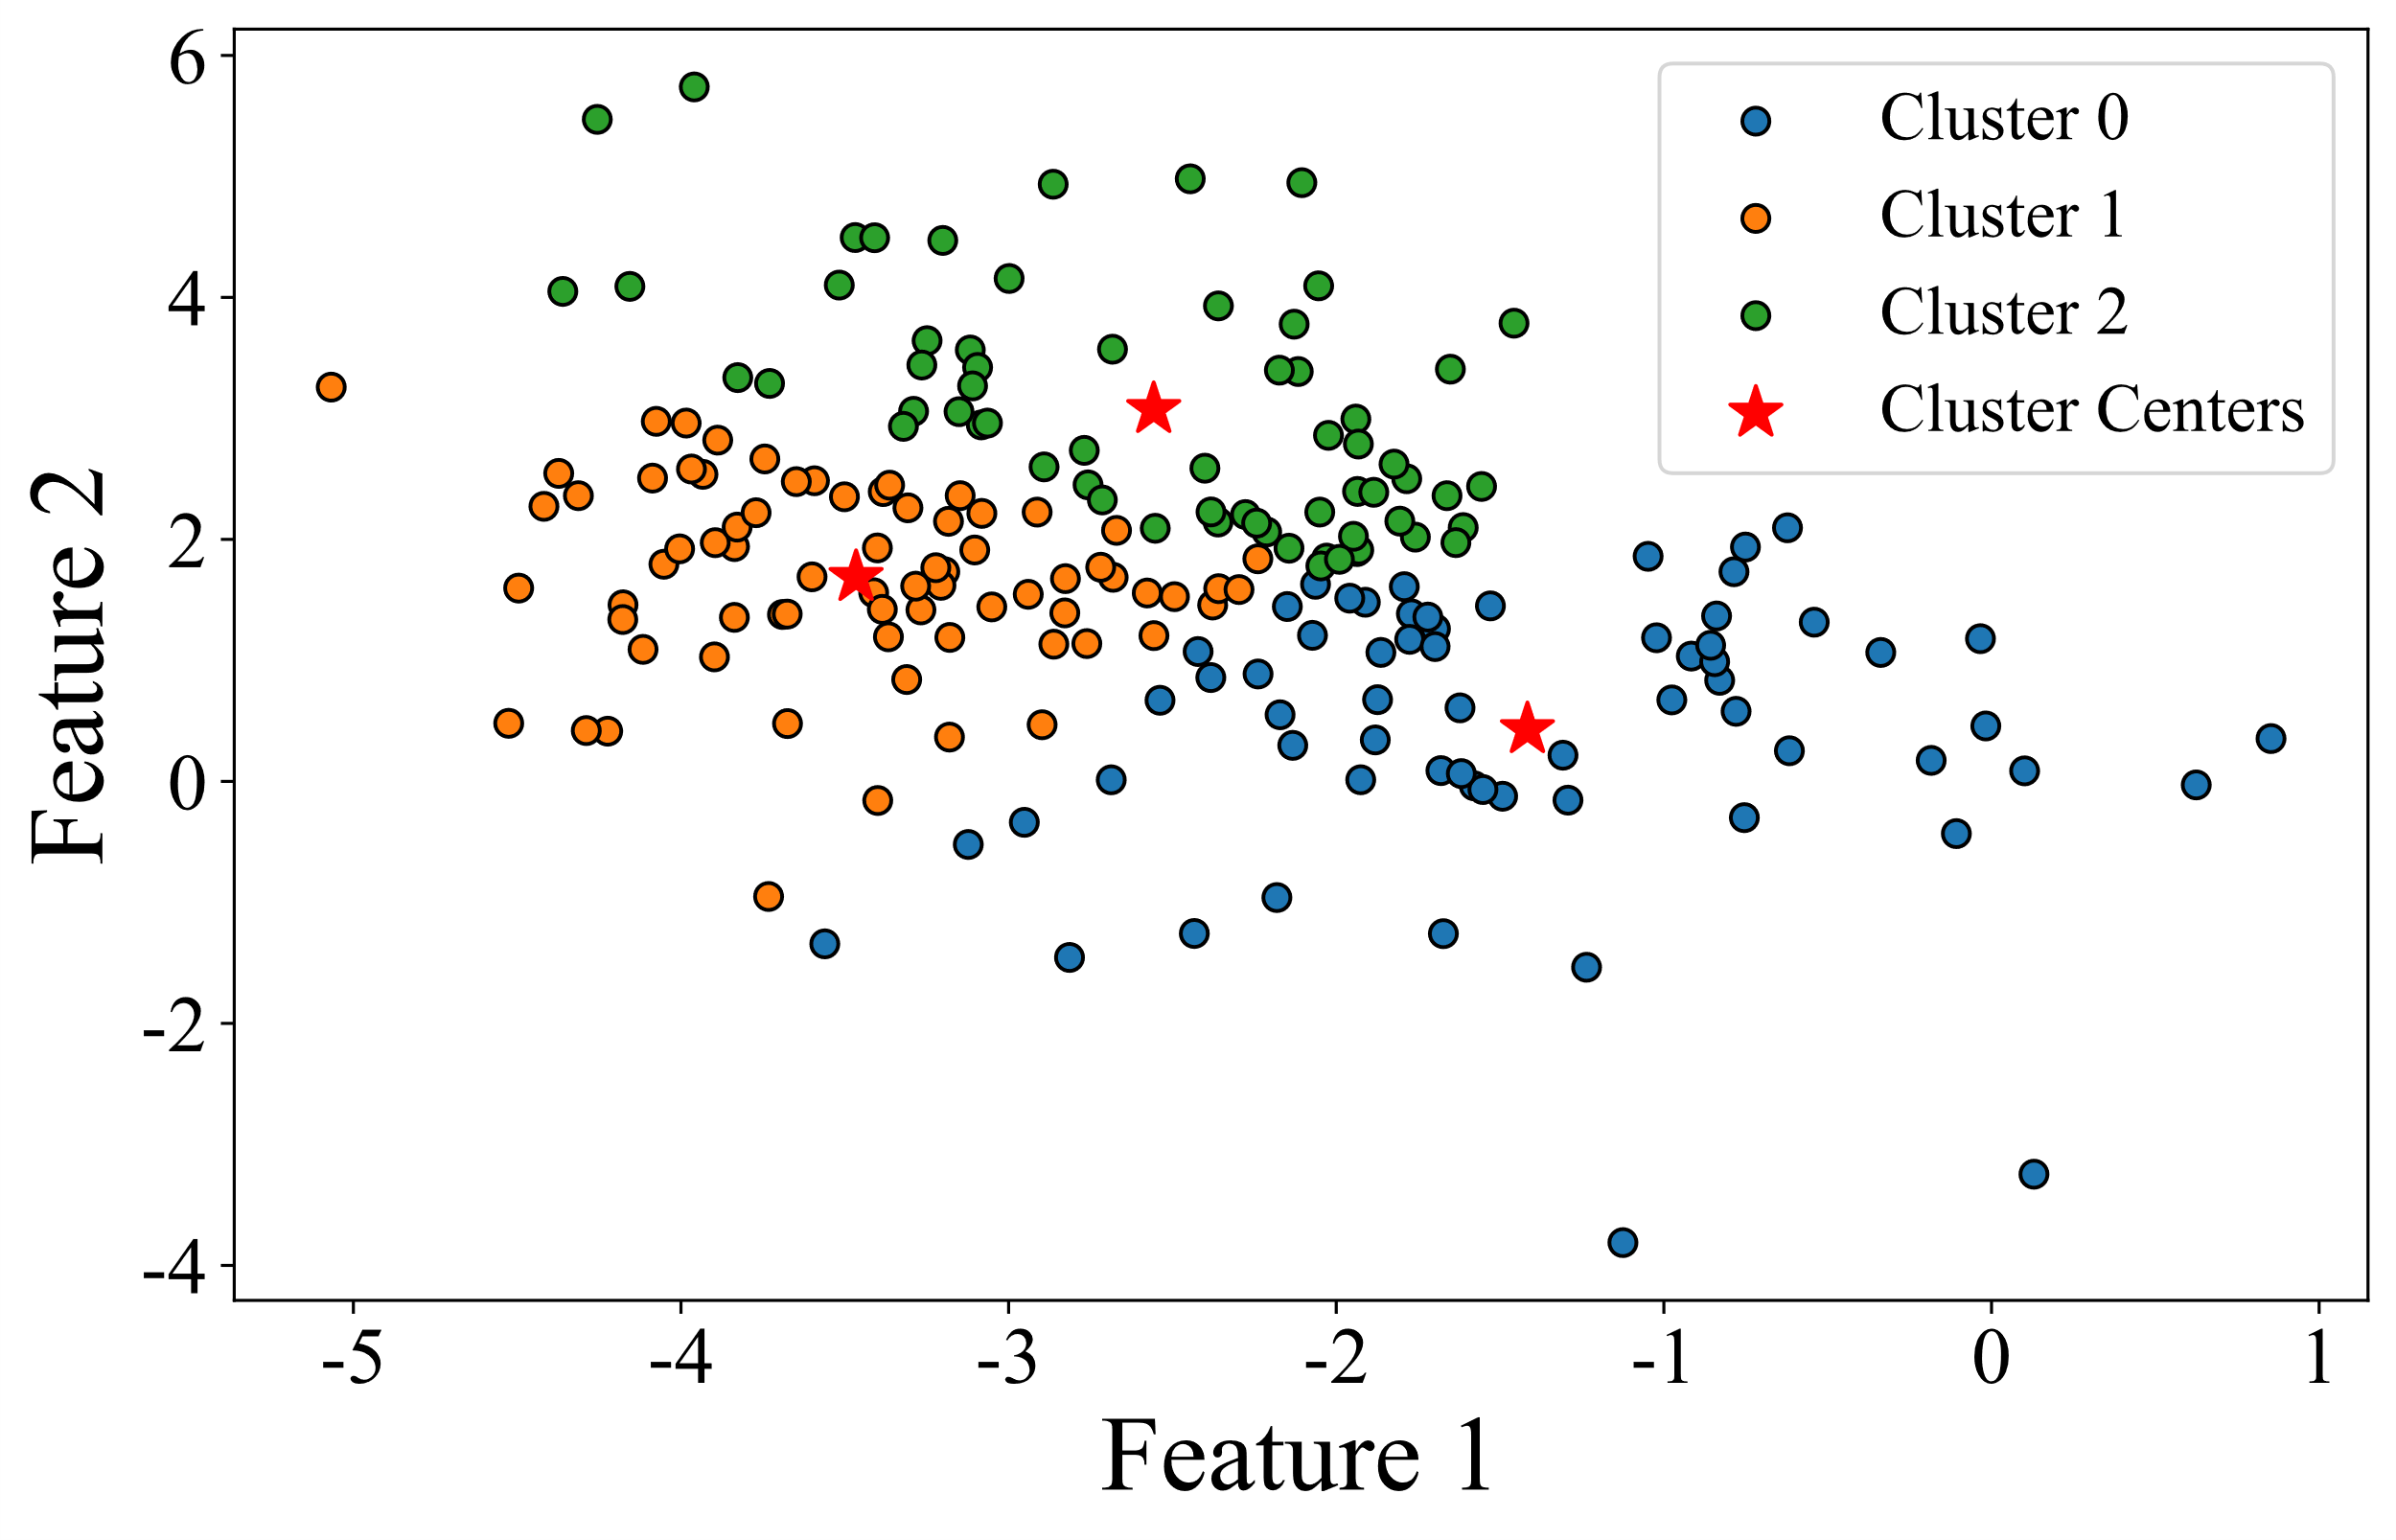
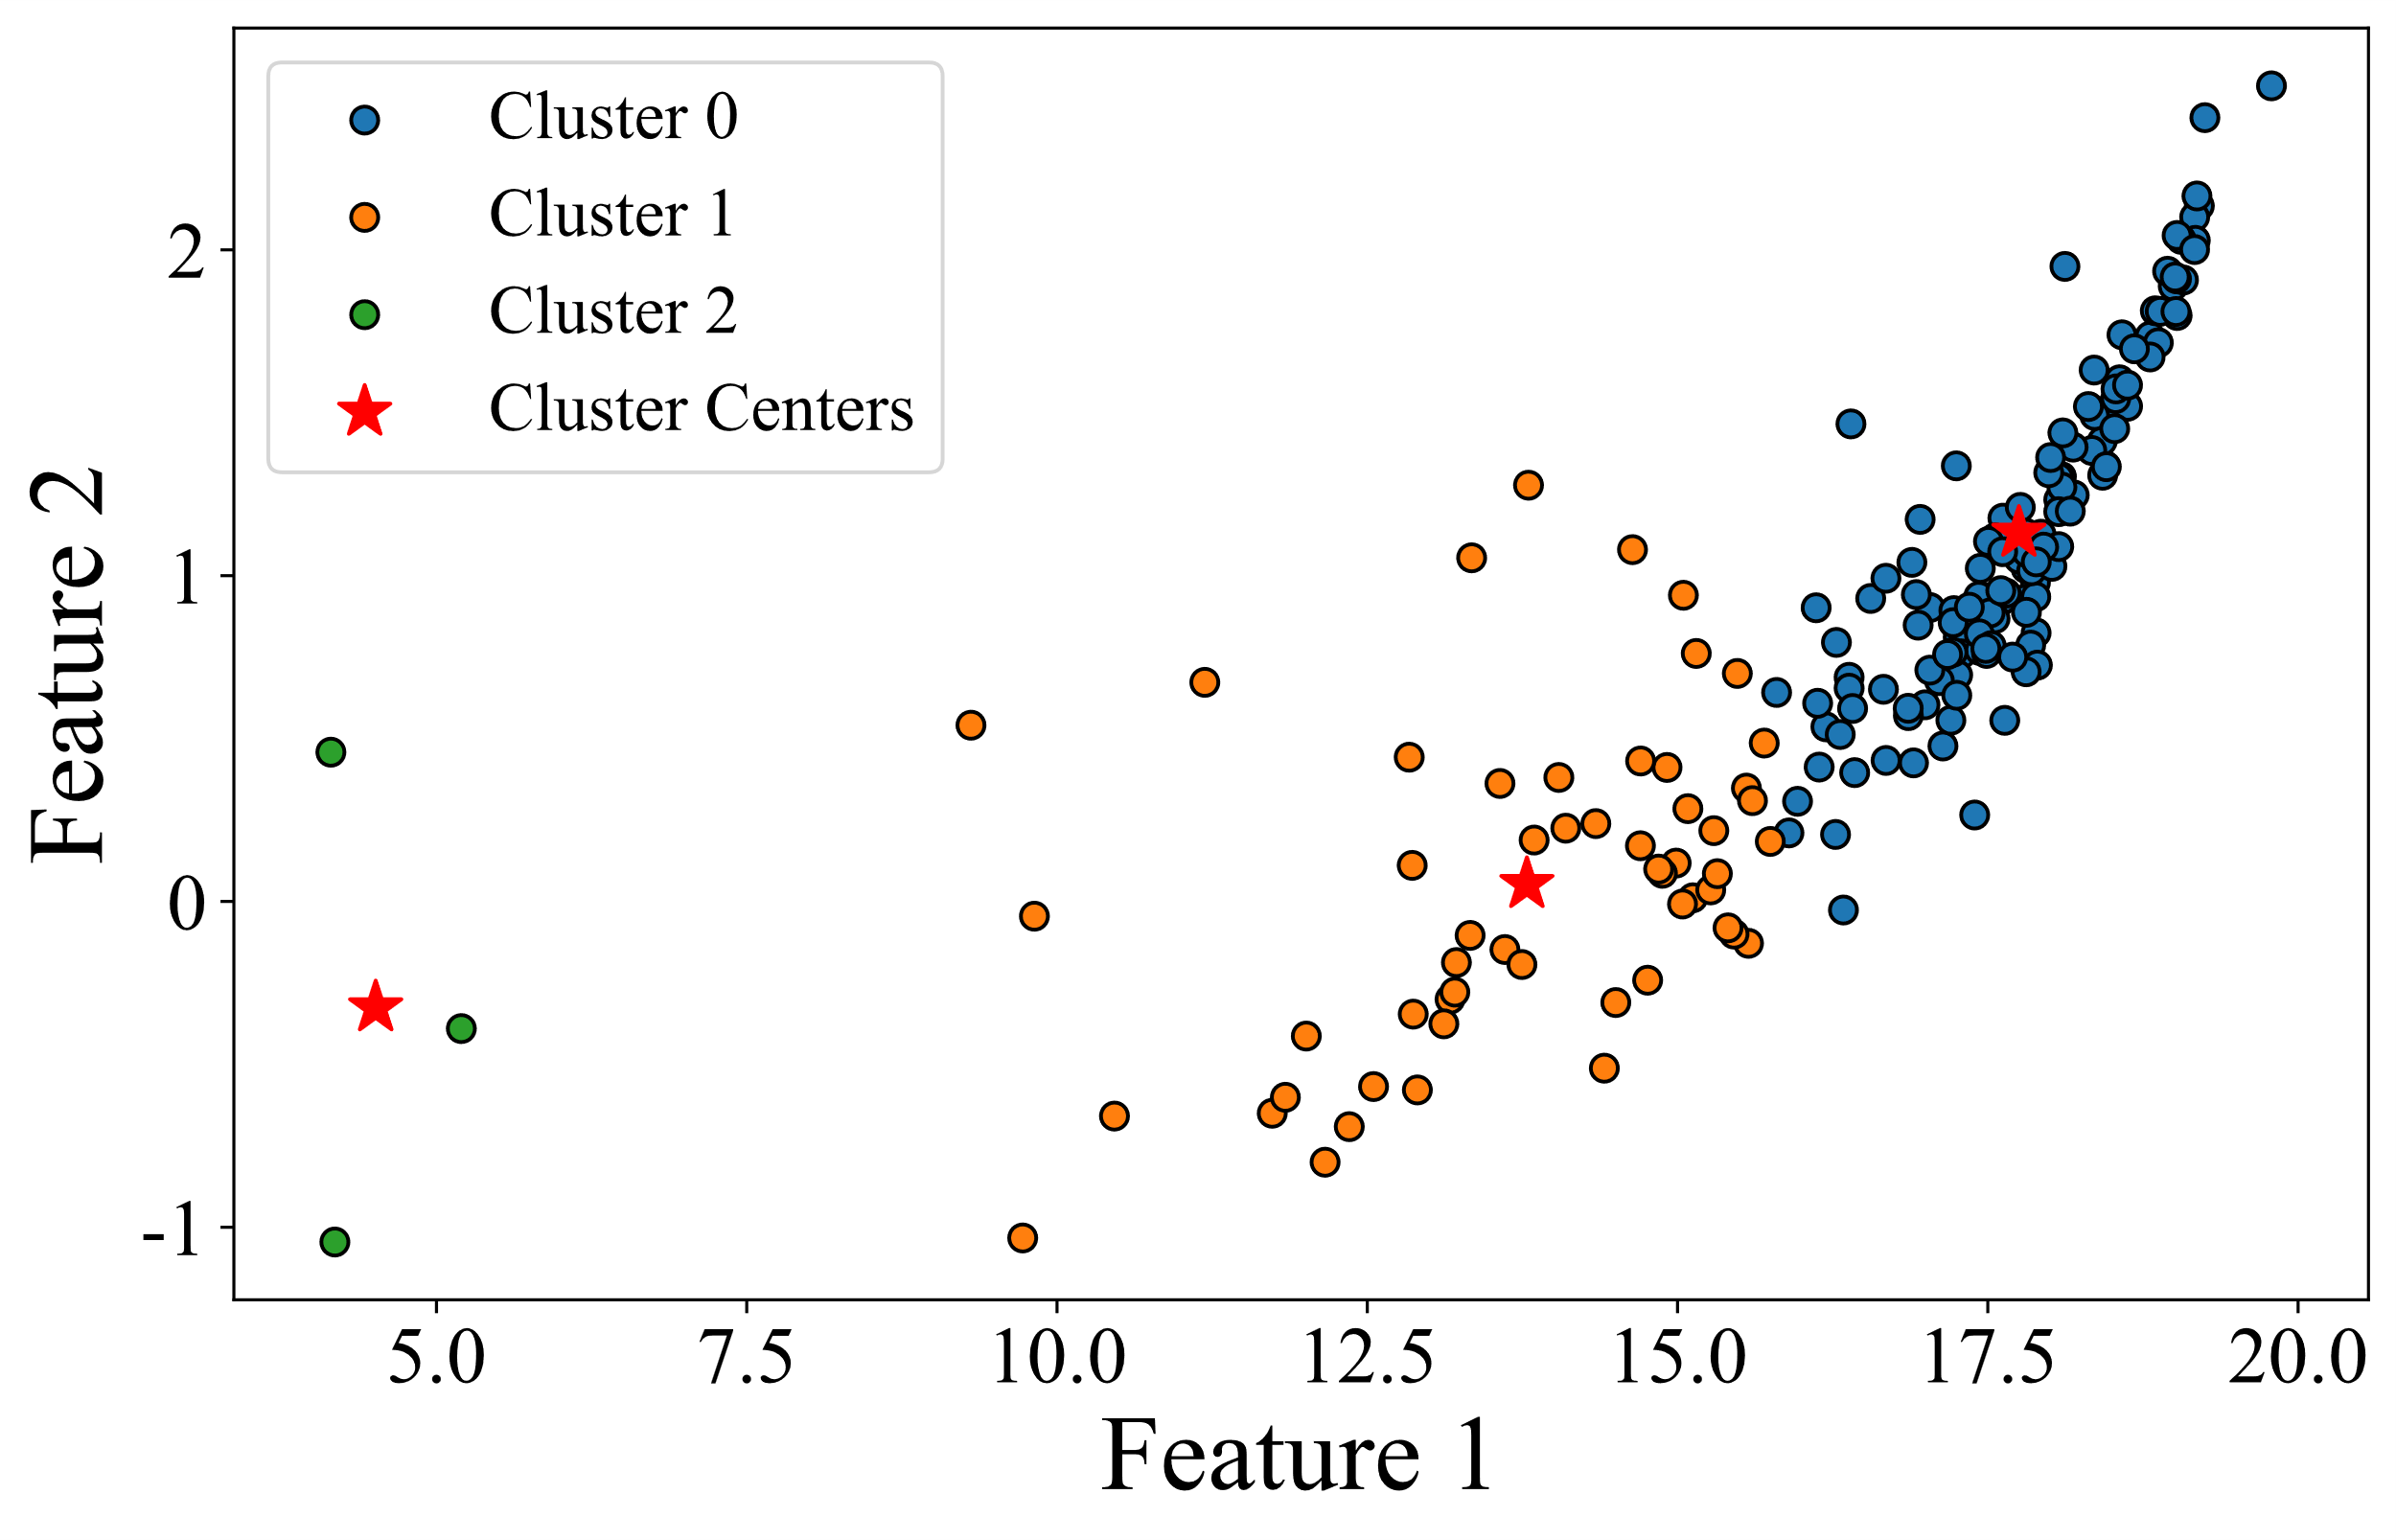
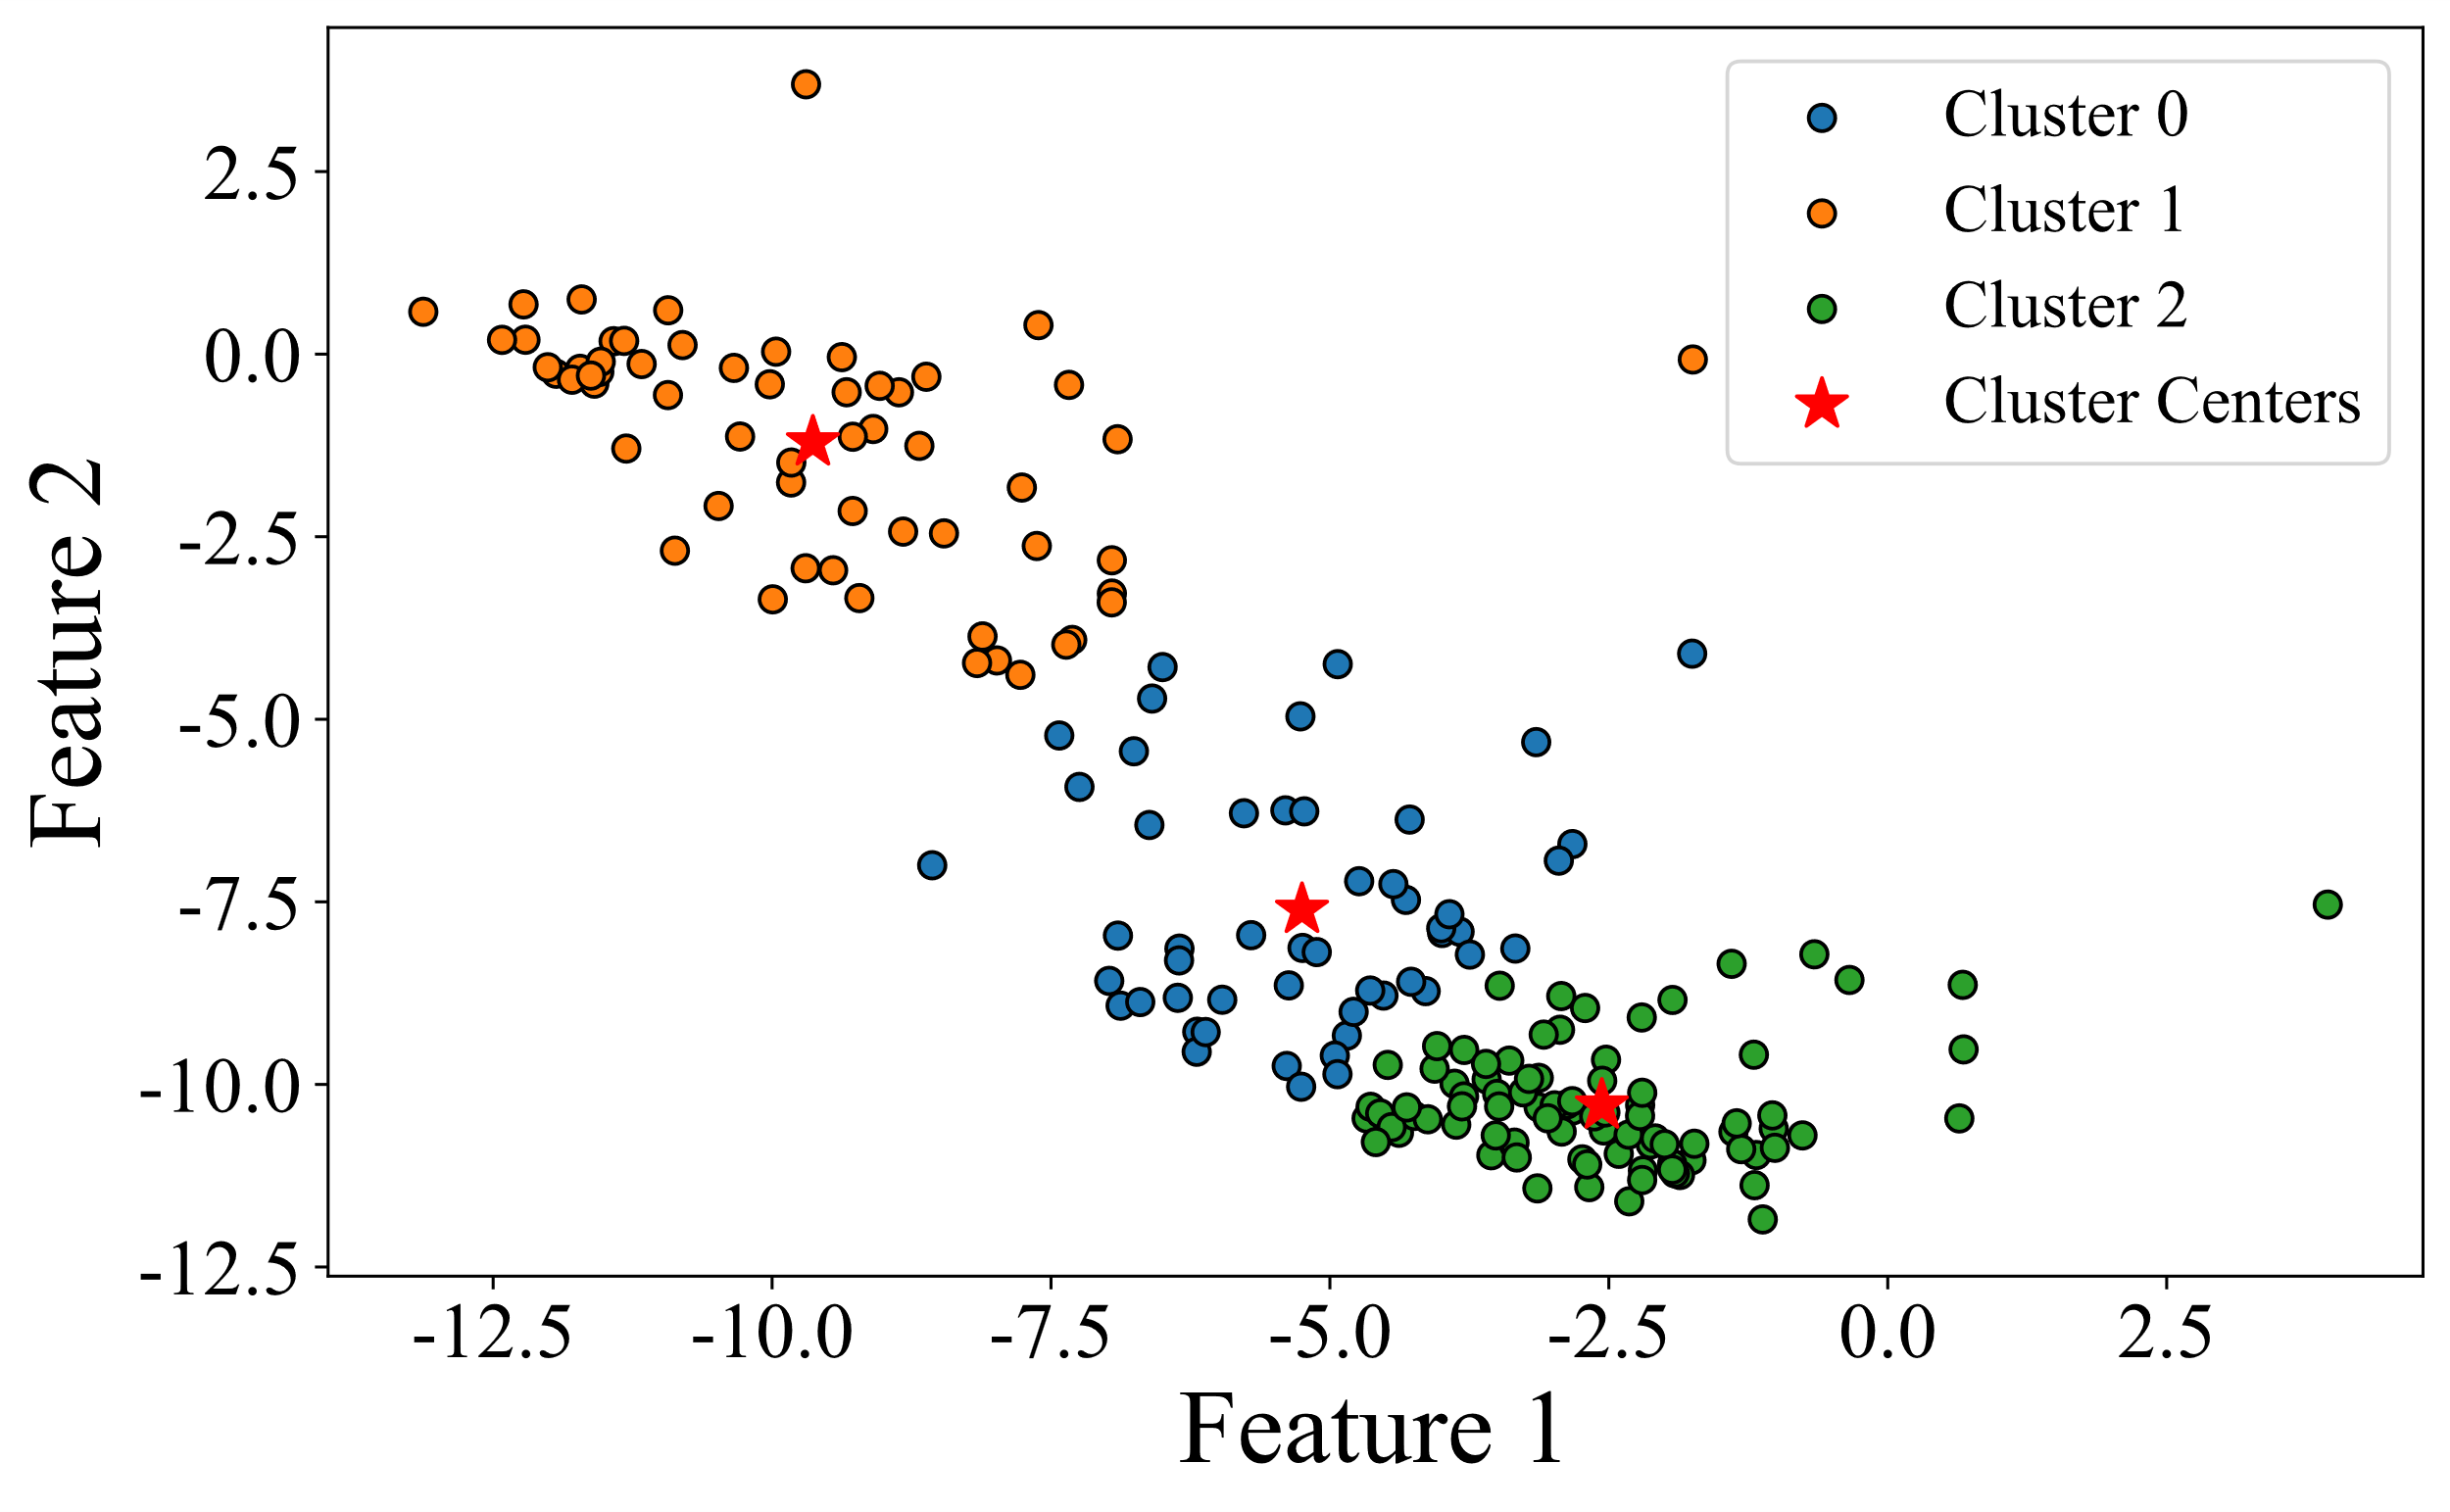
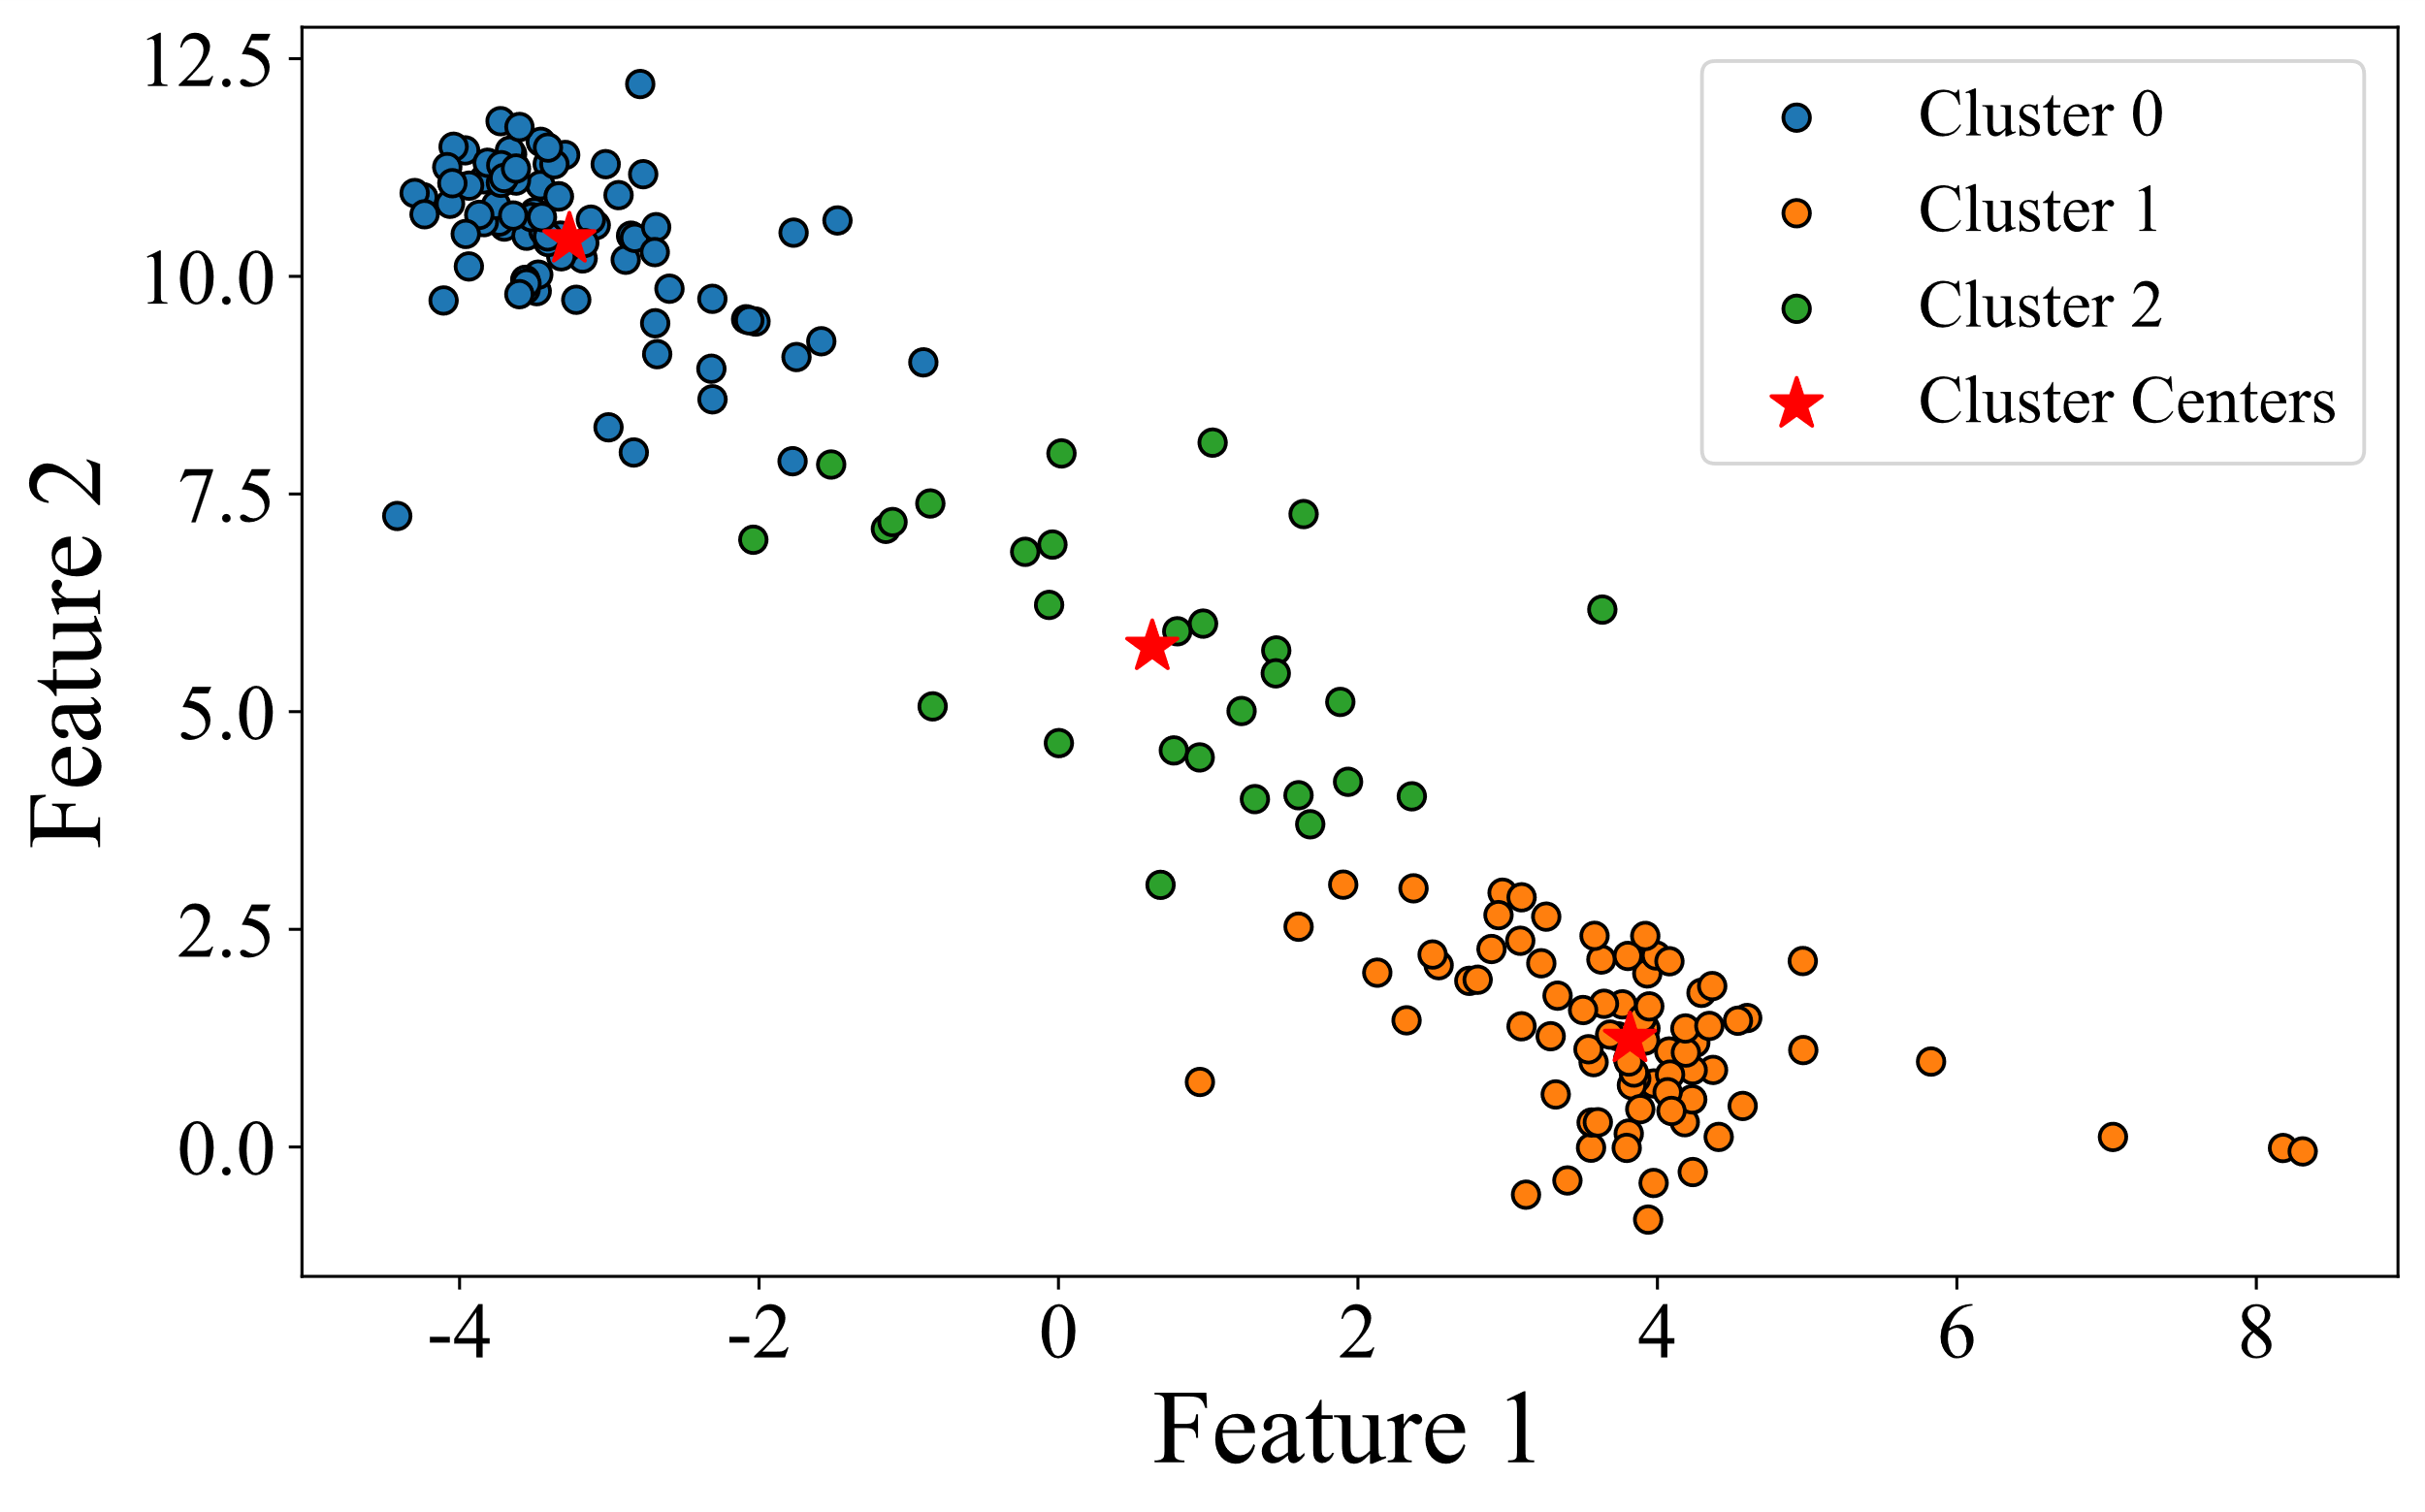
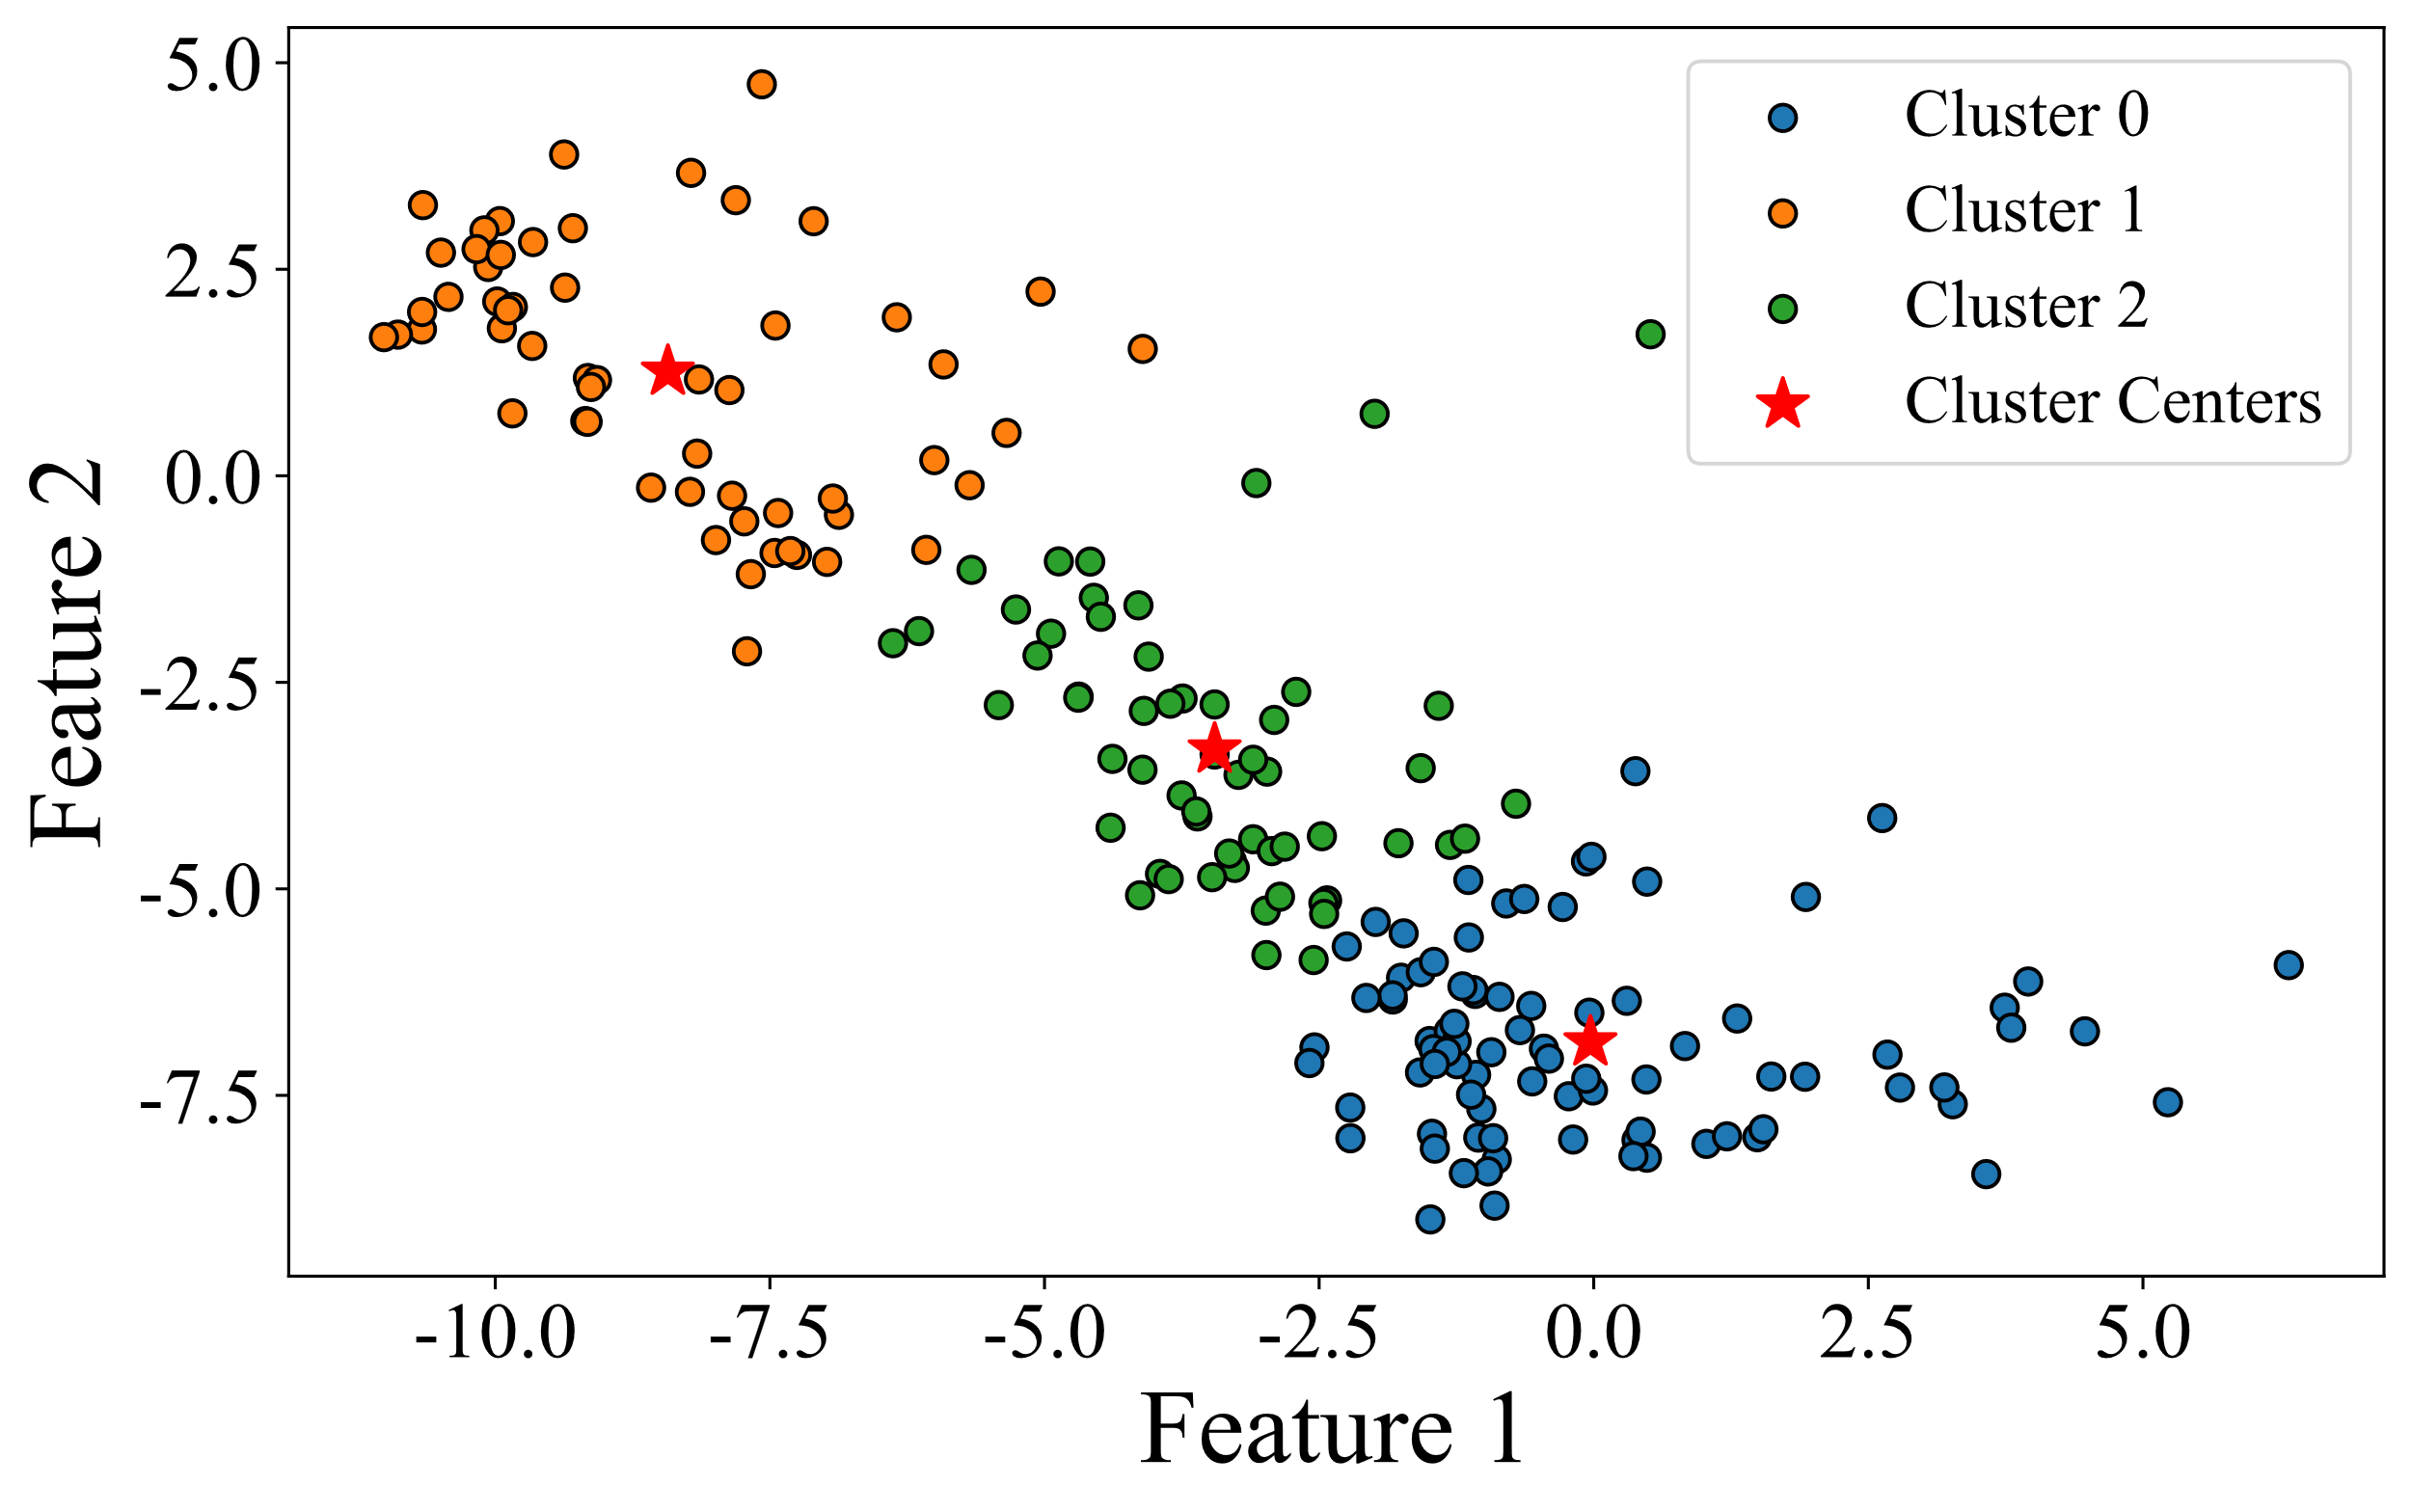
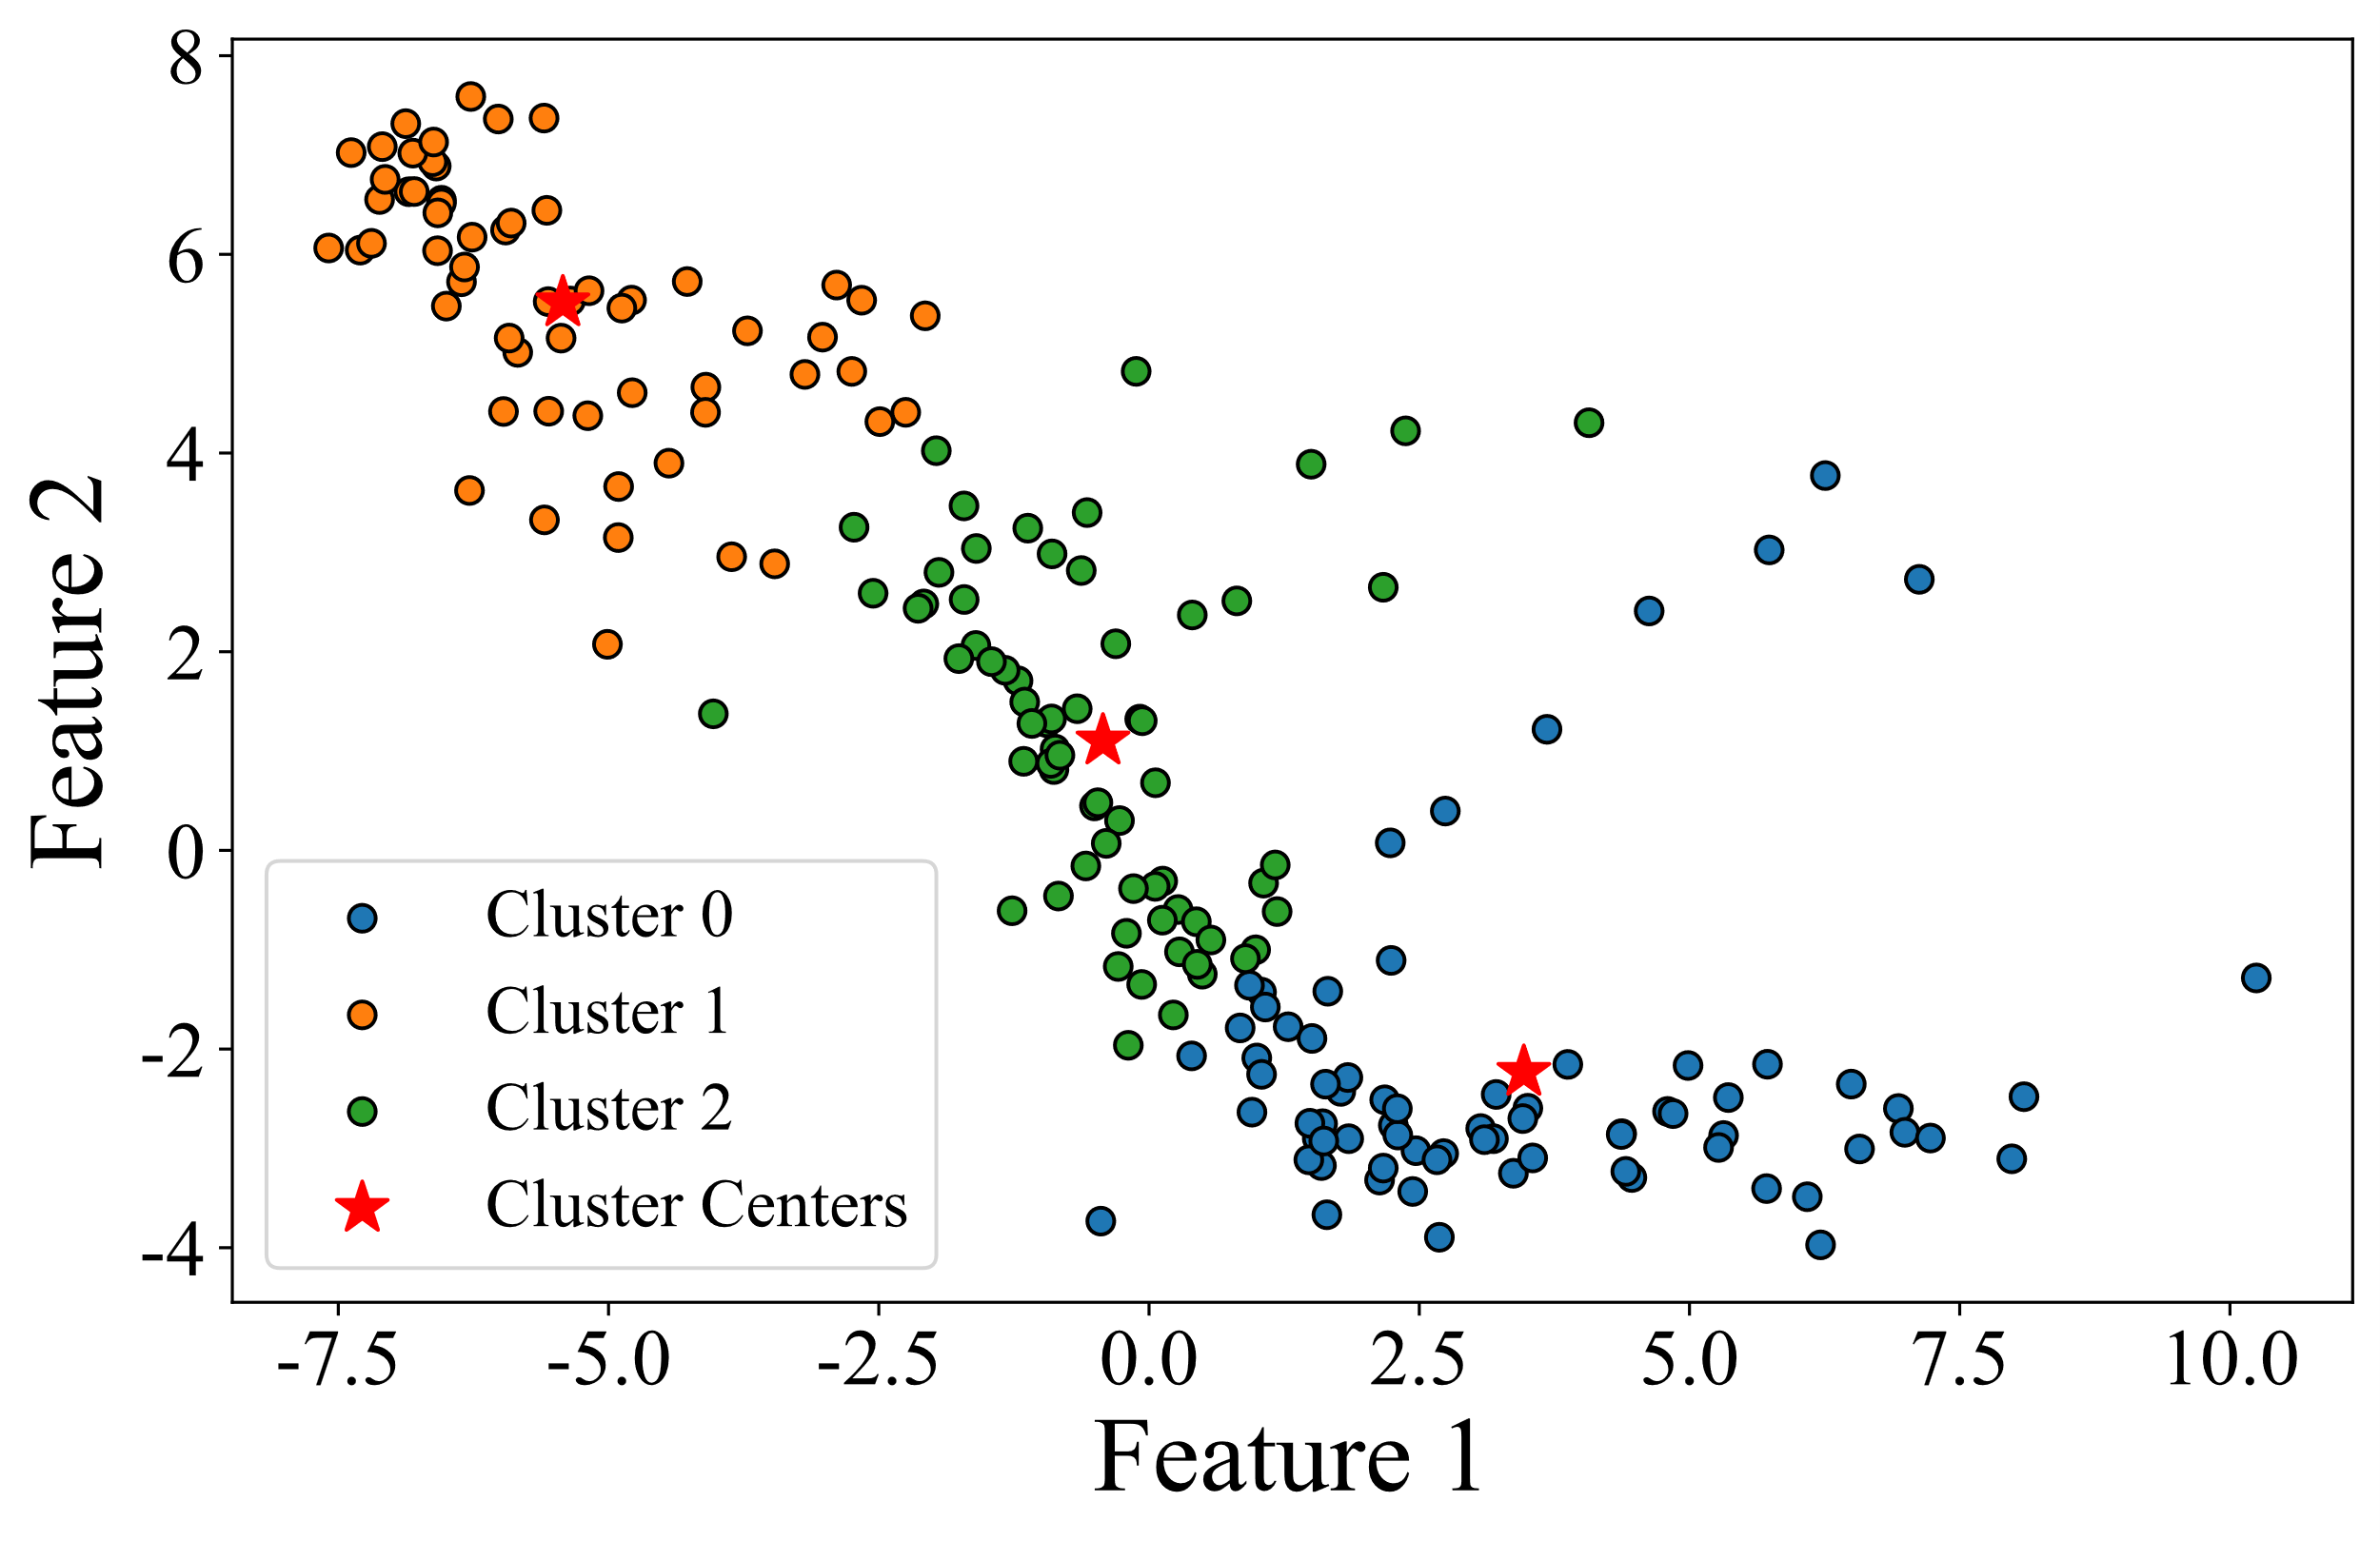
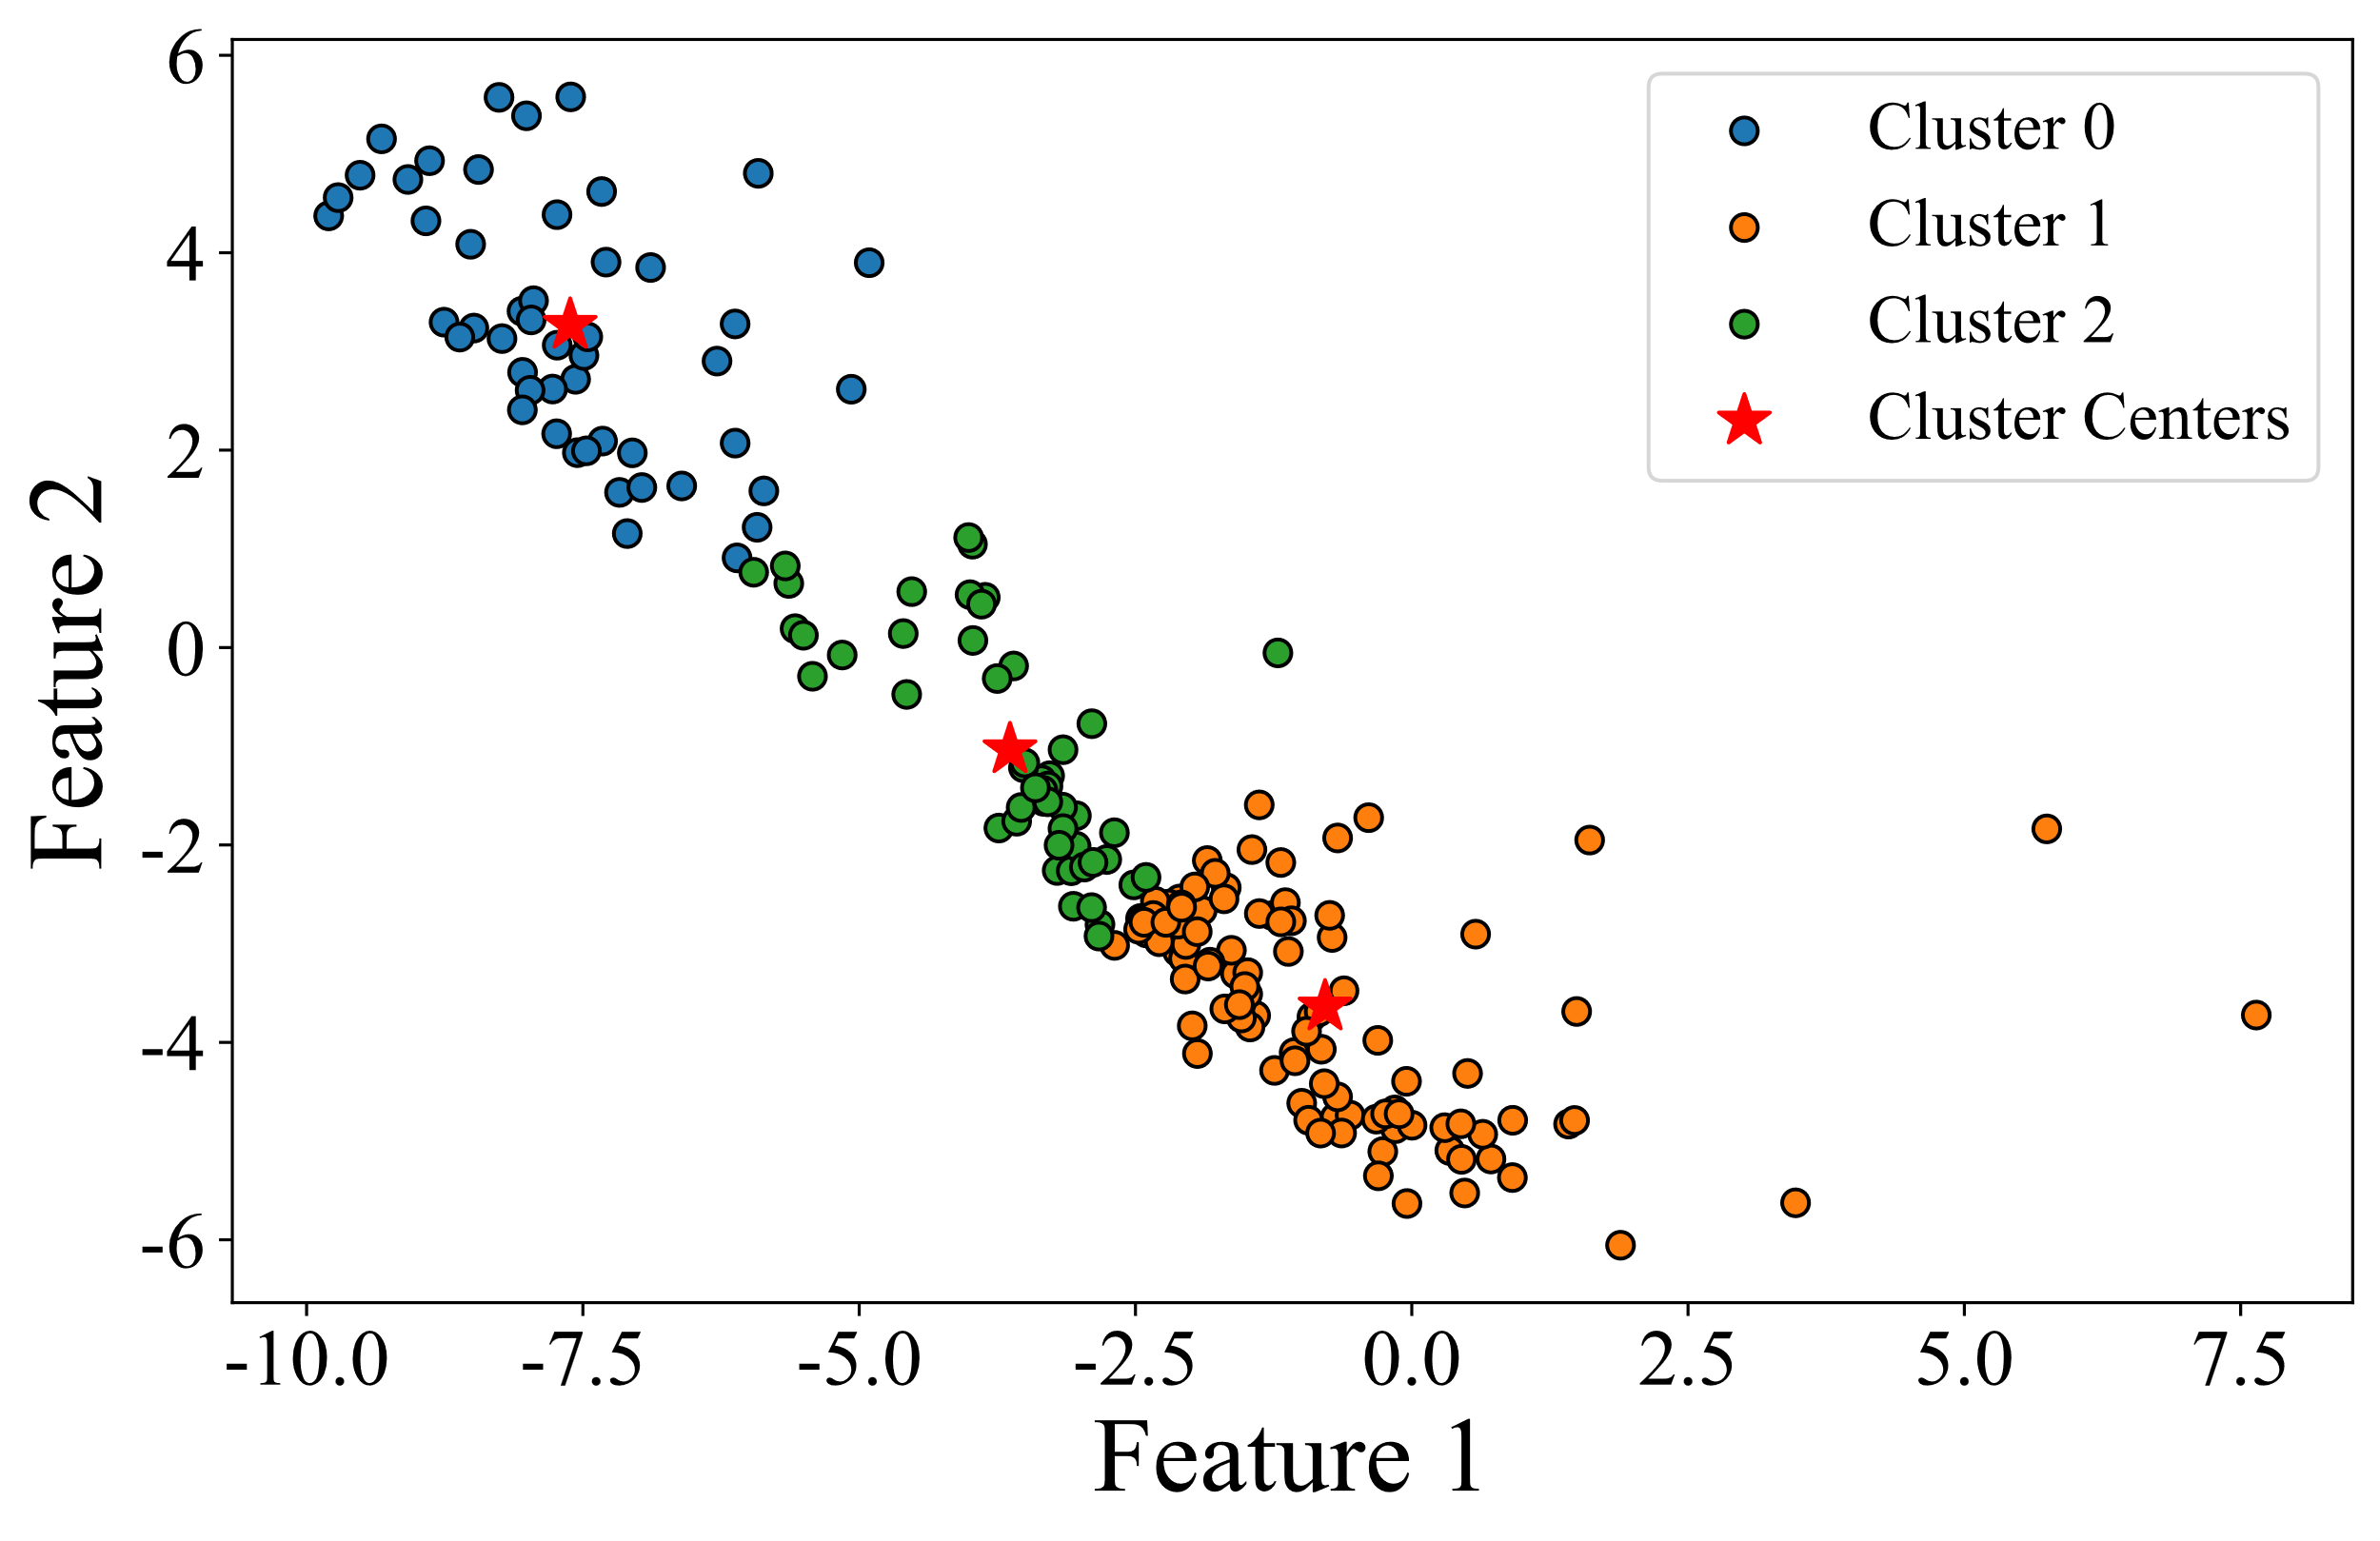
First, following the method described in Section 4.1, the duration of different flight maneuvers was normalized. Taking the loop maneuver as an example, the altitude changes before and after time normalization are shown in Figure 4. It is evident from Figure 4 that before normalization, the durations of the flight maneuvers vary significantly, while after normalization, the durations become uniform. This consistency facilitates the subsequent quantification of anomalies and comparative visual analysis. This consistency facilitates subsequent quantitative analysis and visualization of anomaly levels. Next, the K-Means clustering algorithm was applied to the training and validation datasets for each type of flight maneuver, with the number of clusters set to three. The results are shown in Figure 5, where each point represents a flight maneuver sample, different colors indicate different clusters, and the red stars mark the cluster centers. Finally, the sample closest to the center of each cluster was selected to represent the standard flight maneuver for that category. As a result, each flight maneuver category includes three representative samples. This process ensures that the standard flight maneuver set is both representative and accurate, providing a reliable reference for further anomaly quantification and analysis.
In this section, we randomly selected one sample from the test set of each flight maneuver category. Using the corresponding standard flight maneuver set for each category, we calculated the similarity score based on Equations (9) and (10). The results are shown in Table 4, where the minimum similarity score between the test flight maneuver and the standard maneuver is highlighted in bold. The corresponding standard flight action is used as the reference for that test sample.
|
|
|
|
||||||||
|---|---|---|---|---|---|---|---|---|---|---|---|
| Loop | 0.169 | 0.147 | 0.423 | ||||||||
| Cloverleaf | 0.353 | 0.3097 | 0.504 | ||||||||
| Aileron Roll | 0.965 | 0.922 | 0.857 | ||||||||
| Immelmann turn | 0.356 | 0.387 | 0.592 | ||||||||
| Split-S | 0.553 | 0.531 | 0.609 | ||||||||
| Pull-up | 0.628 | 0.563 | 0.734 | ||||||||
| Push-over | 0.672 | 0.730 | 0.646 | ||||||||
| Circulating | 0.637 | 0.609 | 0.760 |
Next, based on the similarity scores in Table 4, we applied Equations (11) and (12) to compute the anomaly quantification scores for each category’s test flight maneuver, as shown in Table 6. To establish threshold values for defining different anomaly levels, we selected 10 samples from the training and validation sets with expert ratings closest to 2.5 and 4 points, then calculated their abnormality quantification scores. The mean values of these scores were used to establish the threshold values for each category, denoted as and , as shown in Table 5.
| Flight maneuver | ||
|---|---|---|
| Loop | 0.653 | 0.264 |
| Cloverleaf | 0.579 | 0.256 |
| Aileron Roll | 0.765 | 0.342 |
| Immelmann turn | 0.834 | 0.401 |
| Split-S | 0.612 | 0.314 |
| Pull-up | 0.654 | 0.273 |
| Push-over | 0.721 | 0.354 |
| Circulating | 0.752 | 0.342 |
Based on these threshold values, we define the mapping between abnormality quantification scores and performance grades as follows: scores in the range were classified as "Excellent," scores in the range as "Good," and scores in the range as "Poor". Consequently, the anomaly levels for each category’s test flight maneuver are shown in Table 6. These results indicate that the proposed quantitative evaluation method for anomaly levels of complex flight maneuver is effective in evaluating the anomaly levels of different flight maneuvers.
| Test flight maneuver |
|
anomaly level | ||
|---|---|---|---|---|
| Loop | 0.128 | Excellent | ||
| Cloverleaf | 0.236 | Excellent | ||
| Aileron Roll | 0.461 | Good | ||
| Immelmann turn | 0.263 | Excellent | ||
| Split-S | 0.347 | Good | ||
| Pull-up | 0.360 | Good | ||
| Push-over | 0.392 | Good | ||
| Circulating | 0.378 | Good |
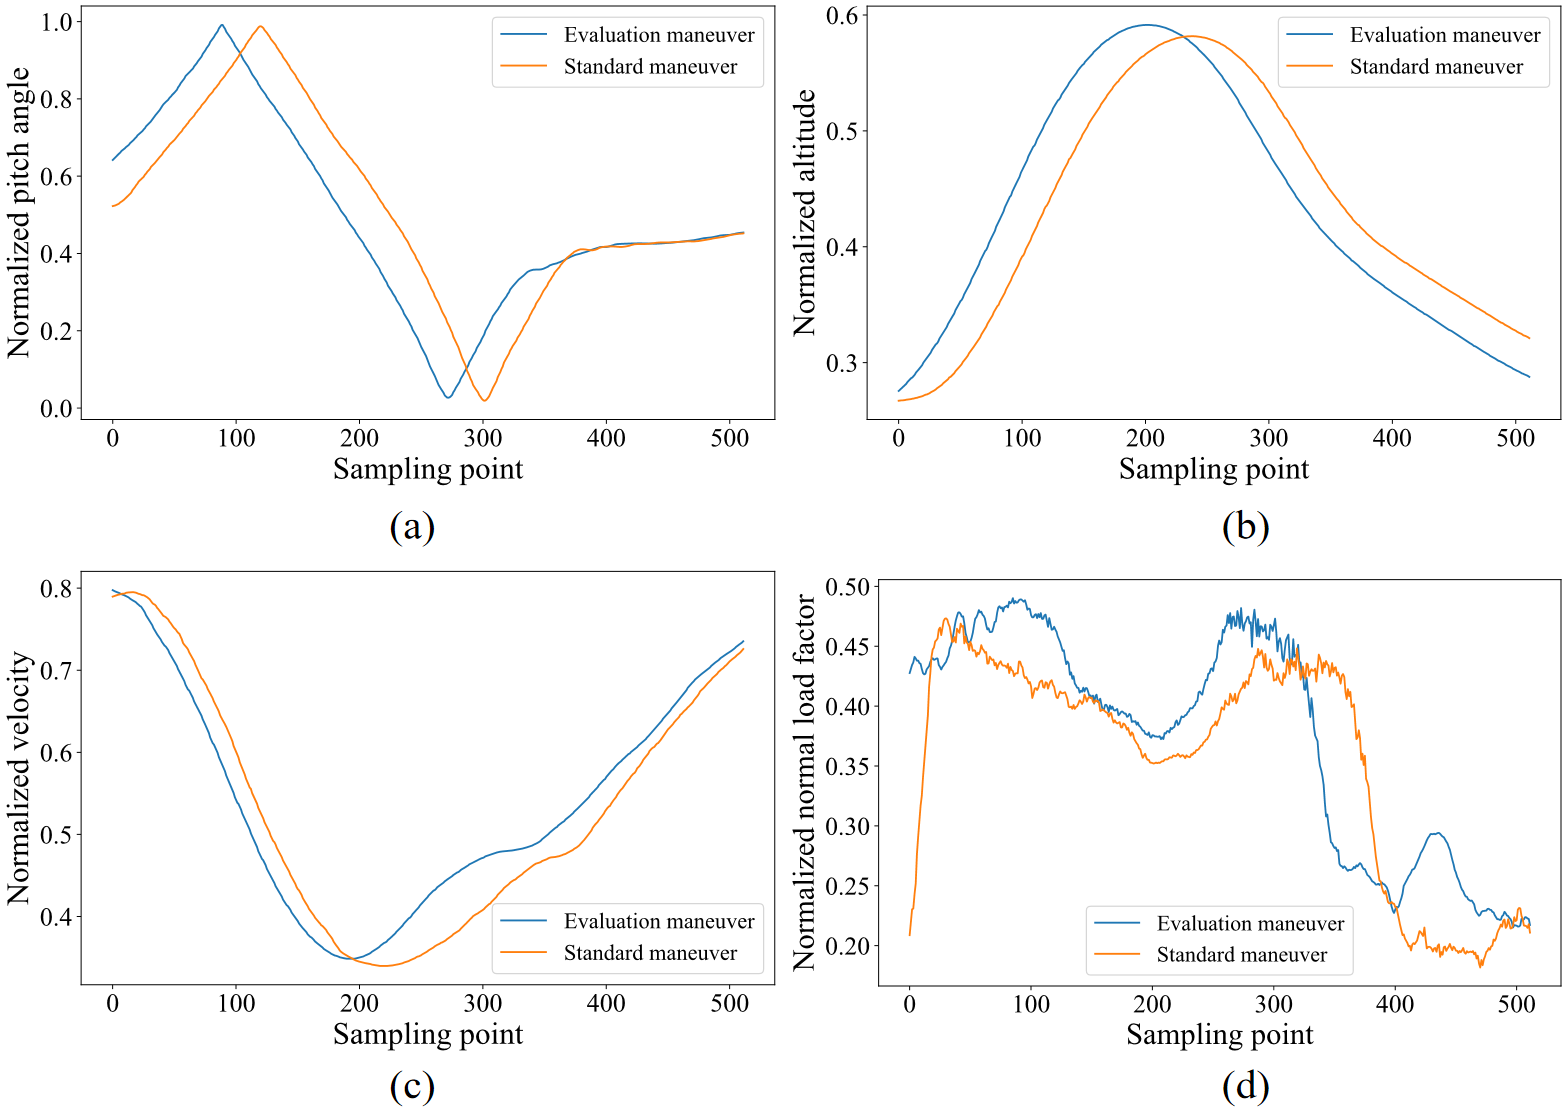
To provide a more intuitive understanding of the abnormality quantification results, we used the "loop" maneuver as an example. Figure 6 shows the comparison of the test flight maneuver sample and the corresponding standard maneuver sample across four dimensions: pitch angle, altitude, velocity, and normal load factor. From Figure 6, it is clear that deviations between the test maneuver and the standard maneuver in these flight parameters can be easily observed, demonstrating the strong interpretability of the proposed method.
This paper presents a novel method to quantify anomaly levels in flight maneuvers, overcoming the limitations of current flight data analysis, which primarily detects anomalies at the parameter level. We developed the 1D-DAMResNet neural network, incorporating a one-dimensional dual attention module, achieving 99.75% accuracy in recognizing complex maneuvers. For anomaly quantification, we used clustering to build a standard maneuver database, setting anomaly thresholds based on training standards and instructor scores. This similarity-based approach ensures interpretable results and supports automated flight training evaluation, promising enhanced safety and reduced costs. Future work will explore feature importance across maneuvers to further improve performance.
 Copyright © 2025 by the Author(s). Published by Institute of Emerging and Computer Engineers. This article is an open access article distributed under the terms and conditions of the Creative Commons Attribution (CC BY) license (https://creativecommons.org/licenses/by/4.0/), which permits use, sharing, adaptation, distribution and reproduction in any medium or format, as long as you give appropriate credit to the original author(s) and the source, provide a link to the Creative Commons licence, and indicate if changes were made.
 Chinese Journal of Information Fusion
ISSN: 2998-3371 (Online) | ISSN: 2998-3363 (Print)
Email: [email protected]

Portico
All published articles are preserved here permanently:
https://www.portico.org/publishers/iece/