Chinese Journal of Information Fusion
ISSN: 2998-3371 (Online) | ISSN: 2998-3363 (Print)
Email: fusion001@csif.org.cn


Due to the time-varying and non-stationary nature of sea clutter, as well as the diversity of target types and motion states [1], data-driven target detection methods based on model feature and deep learning struggle to distinguish targets from clutter signals in actual observation environments. It hinders further improvement in detection performance. Many scholars have explored the complementary effects of different features to enhance detection performance through multi-feature joint detection methods. Current multi-feature joint detection methods primarily rely on convex hull learning algorithms, which are challenging to apply in high-dimensional feature spaces. Time-frequency features, reflecting the changes in frequency distribution of the sea surface background and targets over time, provide effective support for sea surface target detection methods, especially with the improvement in radar resolution [2, 3]. Micro-Doppler theory reveals that sea surface targets exhibit micro-motion characteristics [4, 5], reflecting changes in radial velocity and target image affected by waves (e.g., roll, pitch, yaw), offering additional information for detection. Consequently, time-frequency features have been widely used in sea surface target detection by enhancing the difference in radial velocity variation between targets and sea clutter [6, 7, 8, 9].

However, time-frequency features detection methods face similar challenges as other feature detection methods. The complex sea detection environment and diverse target characteristics result in time-varying micro-motion features of targets. The lack of regular frequency modulation periodic characteristics impacts detection performance [10]. Additionally, factors such as sea spikes cause sea clutter signals to exhibit similar two-dimensional time-frequency characteristics to targets. For instance, some scholars [11] have used CNN to process the time-frequency features of several types of micro-motion targets, achieving target recognition with good performance. However, analysis of sea radar echo data reveals that time-frequency features exhibit unstable performance in distinguishing sea clutter from target signals, primarily related to background characteristics. In sea surface target detection, targets are influenced by factors such as waves, leading to complex and discontinuous echo fluctuations, manifested as discontinuous energy concentration distribution areas in time-frequency features. Moreover, when the target radial speed is low, target is more likely to overlap with clutter on the time-frequency map. Therefore, in actual sea observation environments, one time-frequency features is often insufficient to distinguish targets from clutter.
This article proposes a feature fusion detection method from the perspective of neural network data-driven detection methods, based on time-frequency features. It addresses the limited ability of single-feature detection methods in distinguishing targets and backgrounds in complex sea clutter environments. The Multi-Feature Extraction Network (MFEn) and Graph Fusion and Detection Network (GFDn) detection methods are proposed. It represents multiple features of signal samples through graph representation and achieve multi-feature fusion detection through graph classification.
Under actual detection conditions, amplitude time-frequency features detection faces numerous challenges due to the influence of complex environments and target characteristics. The amplitude feature significantly reduces the discriminability between targets and clutter signals under high sea conditions or weak targets. The Short-time Fourier Transform (STFT) time-frequency features also struggles to distinguish targets from clutter signals in many cases, as shown in Figure 1. Clutter signals may exhibit a wide Doppler range. And targets may have lower radial velocities during motion. So that clutter may cover targets in time-frequency features. Additionally, clutter sometimes exhibits similar characteristics to targets, resulting in missed alarms and false alarms.
To address the instability of single-model features in distinguishing target and clutter samples under complex conditions, increasing model feature types is a crucial way to enhance detection performance. Some target signals may be difficult to distinguish from clutter in certain features but exhibit high distinguishability in other feature domains [12]. However, as the dimensionality of features increases, integrating multiple features and making decisions to generate detection results becomes a key and challenging research problem. The DCCNN fusion detection method [13] extracts more class features by increasing the number of channels, obtaining high-dimensional combined features. Fusion detection is performed through a feature fusion classifier. However, as the feature dimension increases, the number of network parameters significantly rises, leading to difficulties in model training and fitting. Furthermore, expanding the training dataset is an essential way to improve the detection performance and generalization ability of deep learning methods. In practical detection tasks, the network used for detection is obtained through parameter optimization using a fixed finite dataset. However, the diversity of potential target types, motion types, and background features makes it challenging to achieve stable detection performance when there is a significant difference between the target being tested and the samples in the training dataset.
In response to these issues, this paper proposes an MFEn-GFDn detection method for target detection, improving the detection performance of multi-feature neural network detection methods under complex conditions. Self-supervised and adaptive structures are used to replace various components of the complex network [14], solving the problem of model training and enhancing the model's generalization ability.
Compared to the DCCNN method, the MFEn-GFDn fusion detection method has the following differences: 1) In hidden feature extraction channel structure, different input features share the same channel; 2) hidden features form a combination of graph structures through graph representation, replacing feature concatenation and combination; 3) GFDn extracts and aggregates features from graph data composed of different features, instead of relying solely on the Multi-Layer Perceptron (MLP) module in DCCNN for feature fusion detection.


As shown in Figure 2, the Multi-Feature Extraction Network (MFEn) is constructed using the encoder part of a Convolutional Autoencoder (CAE), consisting of 2 convolutional layers, 2 pooling layers, and 1 fully connected layer. The first convolutional layer has 64 3x3 convolution kernels, and the second convolutional layer has 128 3x3 convolution kernels. The fully connected layer outputs a 256-dimensional vector of hidden features. Parameter optimization is achieved through training with a convolutional autoencoder. Similar to autoencoders (AE), CAE includes both encoder and decoder parts, and its training process involves encoding and decoding stages. In the encoding stage, the CAE encoder encodes the input data and maps the features to the hidden layer space. Subsequently, the decoder decodes the hidden layer features output by the encoder and reconstructs the corresponding input data. After training, the encoder part is used for feature extraction channels. Autoencoder (AE) is an unsupervised neural network model that can learn hidden features of input data for dimensionality reduction. CAE introduces convolutional layer operations, enhancing the feature extraction capability for two-dimensional data such as time-frequency maps. Additionally, during the training process, the loss function of CAE is a function of the reconstructed output data and the input raw data, rather than a function of the classification labels, reducing the interference of data labeling errors when training the feature extraction network.
Multiple hidden features are extracted from different model features of the same signal sample using MFEn for graph representation, with each sample corresponding to a Multi-Feature Graph Data (MFG) . Each node in the node set of MFG corresponds to a hidden feature of the sample. The feature matrix of MFG is the set of all hidden feature information, represents the node dimension of MFG, and represents the dimension of node features. The nodes form a fully connected graph through fully connected connections, where the edge set is represented in the form of an adjacency matrix and then becomes a fully 1 matrix.
In the process of fusing hidden features through fully connected layers, due to the fixed parameters of the trained network, each feature corresponds to a fixed weight during the fusion process. However, there is a lack of stable and effective modeling criteria for the correlation information of different features under actual detection conditions. Therefore, a Graph Fusion and Detection Network (GFDn) structure is proposed, which obtains fusion weights through network parameter learning and adaptively adjusts the weights based on hidden feature information. The MFG and GFDn structures are shown in Figure 3.
The final detection result of MFG in Figure 3 was obtained through GFDn fusion detection. During this process, the data dimension is reduced from dimensionality to a single scalar , representing the probability of the sample being classified as the target. GFDn consists of a feature fusion network and a feature detection network. The feature fusion network consists of a graph attention convolutional layer, a graph pooling layer [15], and a feature reading module. In the graph attention convolutional layer, each node serves as a central node, and its features are fused with those of other nodes using corresponding attention coefficients.
where is the parameter of feature extraction in this layer, is the input feature of node in this layer. , the preliminary feature extraction result, is obtained from via . is the preliminary attention coefficient between paired nodes. is the attention parameter matrix. is the mask of neighboring nodes. is the output of this graph attention convolutional layer.
The graph pooling layer determines the nodes to be retained in the layer based on the pooling attention coefficients of each node. After multiple pooling layers, the multiple feature fusion results of one node are ultimately retained as the final embedded feature after fusion. The graph attention convolutional layer achieves the fusion of input feature class variables. In this article, the input graph data node feature dimension is , indicating the dimension of hidden features.

Figure 4 is an example of the graph pooling layer. During the graph pooling process, the node dimension of sample features , i.e., the number of hidden features, is reduced from from 1 through multiple graph pooling layers. In the th pooling layer of the graph, the pooling attention coefficient of each node is first calculated based on the network parameters of the layer and the node features , input to the layer as .
Then, based on the set graph pooling rate , the index of the reserved nodes in this layer is obtained as:
where is the graph attention mask.
where is the feature of each node based on the node index, represents the operation of preserving the node feature of some nodes based on the mask, and is the adjacency matrix of the graph data after preserving some nodes based on the index. and represent the node features and adjacency matrix of the output graph data from this layer.
The MFG of GFDn input in this paper consists of 12 nodes, corresponding to 12 hidden features. Graph pooling layer 1 retains 6 nodes, graph pooling layer 2 retains 3 nodes, and graph pooling layer 3 retains 1 node. After each pooling layer, the output features of that layer are read through feature reading operations,
The embedded features obtained by concatenating the output features of each layer are input into the feature detection network. The feature detection network is an MLP composed of two fully connected layers, with output dimensions of 64 and 2, respectively, to achieve the process of obtaining detection results from the fused embedded features.
This article tests the performance of the proposed method by measuring the IPIX dataset of resident mode radar signals. Staring mode radar signals consists of multiple coherent pulse signals over a long observation time, which is suitable for extracting various features of the detection samples.
Intelligent Pixel Processing (IPIX) [16] data is a commonly applied high-resolution sea clutter measurement data in sea clutter-related research. It was collected by Haykin from McMaster University through measurement and acquisition experiments using IPIX radar in 1993 (Dartmouth, Nova Scotia) and 1998 (Grimsby, Ontario). The radar parameters, data formats, and other related information are shown in Tables 1 and 2. Three sets of data from the 1993 experiment are applied for method performance validation in this paper.
| Radar parameters | |||
|---|---|---|---|
| Antenna gain | 44dB | Peak power | 8kW |
| Sidelobe | -30dB | Antenna diameter | 2.4m |
| Instantaneous dynamic range | 50dB | Beamwidth | 0.9° |
| Range resolution | 30m | Bandwidth | 5MHz |
| Polarization | HH/VV/HV/VH | Pulse repetition frequency | 1000Hz |
| No. | File name | Target Unit | Protection unit | Sea state |
|---|---|---|---|---|
| IPIX01 | 19931108_220902_starea | 7 | 6, 8 | 2 |
| IPIX02 | 19931118_023604_stareC0000 | 8 | 7, 9-10 | 3 |
| IPIX03 | 19931107_135603_starea | 9 | 8, 10-11 | 4 |
Amplitude and time-frequency features are widely studied in radar target detection. In recent years, scholars have proposed many feature models for target detection. In this experiment, multiple features include signals with different polarization modes and time-frequency maps obtained by different time-frequency analysis methods. There are significant differences in the echo characteristics of signals with different polarization modes. Taking IPIX01 data as an example, the data includes radar signal data with four polarization modes: HH, HV, VH, and VV. Through experiments, it was found that there are significant differences in the target detection performance of these four types of data. A dataset was constructed using 6000 clutter samples and 6000 target samples, and binary classification was performed using LeNet. The results are shown in Table 3.
| Polarization mode | HH | HV | VH | VV |
|---|---|---|---|---|
| Accuracy (target) | 89.57% | 87.04% | 87.18% | 88.70% |
| Accuracy (clutter) | 96.74% | 96.15% | 97.28% | 97.08% |
From Table 3, it can be seen that data with different polarization modes exhibit various distinguishability for targets and clutter samples. HH polarization is of weaker reflection on sea surface clutter, especially in low sea conditions. The sea surface echo intensity is lower, improving the contrast between the target and clutter. STFT is a classical time-frequency analysis method in the analyzing sea clutter signals [17]. However, window functions causes energy emission. The Wigner Ville Distribution (WVD) method avoids the energy emission problem caused by window functions. But cross interference terms limits the performance of WVD. When analyzing sea clutter, it exhibits good energy accumulation effect on the target signal. While Smoothed Pseudo Wigner Ville Distribution (SPWVD) suppresses cross term interference based on WVD. As shown in Figure 5, the model features involved in this section include three time-frequency model of four types of polarization signals, STFT, WVD, and SPWVD, totaling 12 features.


This paper proposes a multi feature fusion network structure. Time-frequency features are studied as an example, without further research on model features in other domains. The experimental environment is TensorFlow 1.13. The training parameters includes a batch size of 32, a learning rate of 0.01, an epoch of 10000. Parameter initialization is Xavier. And bias initialization is 0. The parameter optimization strategy adopts gradient descent optimizer and MSE loss function. GFDn adopts ADAM optimizer and cross entropy loss function.
7 training datasets are built using IPIX01-03 data, as shown in Table 4.
| No. | Training set data |
|---|---|
| 1 | IPIX01 |
| 2 | IPIX02 |
| 3 | IPIX03 |
| 4 | IPIX01,IPIX02,IPIX03 mixture |
| 5 | IPIX01,IPIX02 mixture |
| 6 | IPIX01,IPIX03 mixture |
| 7 | IPIX02,IPIX03 mixture |
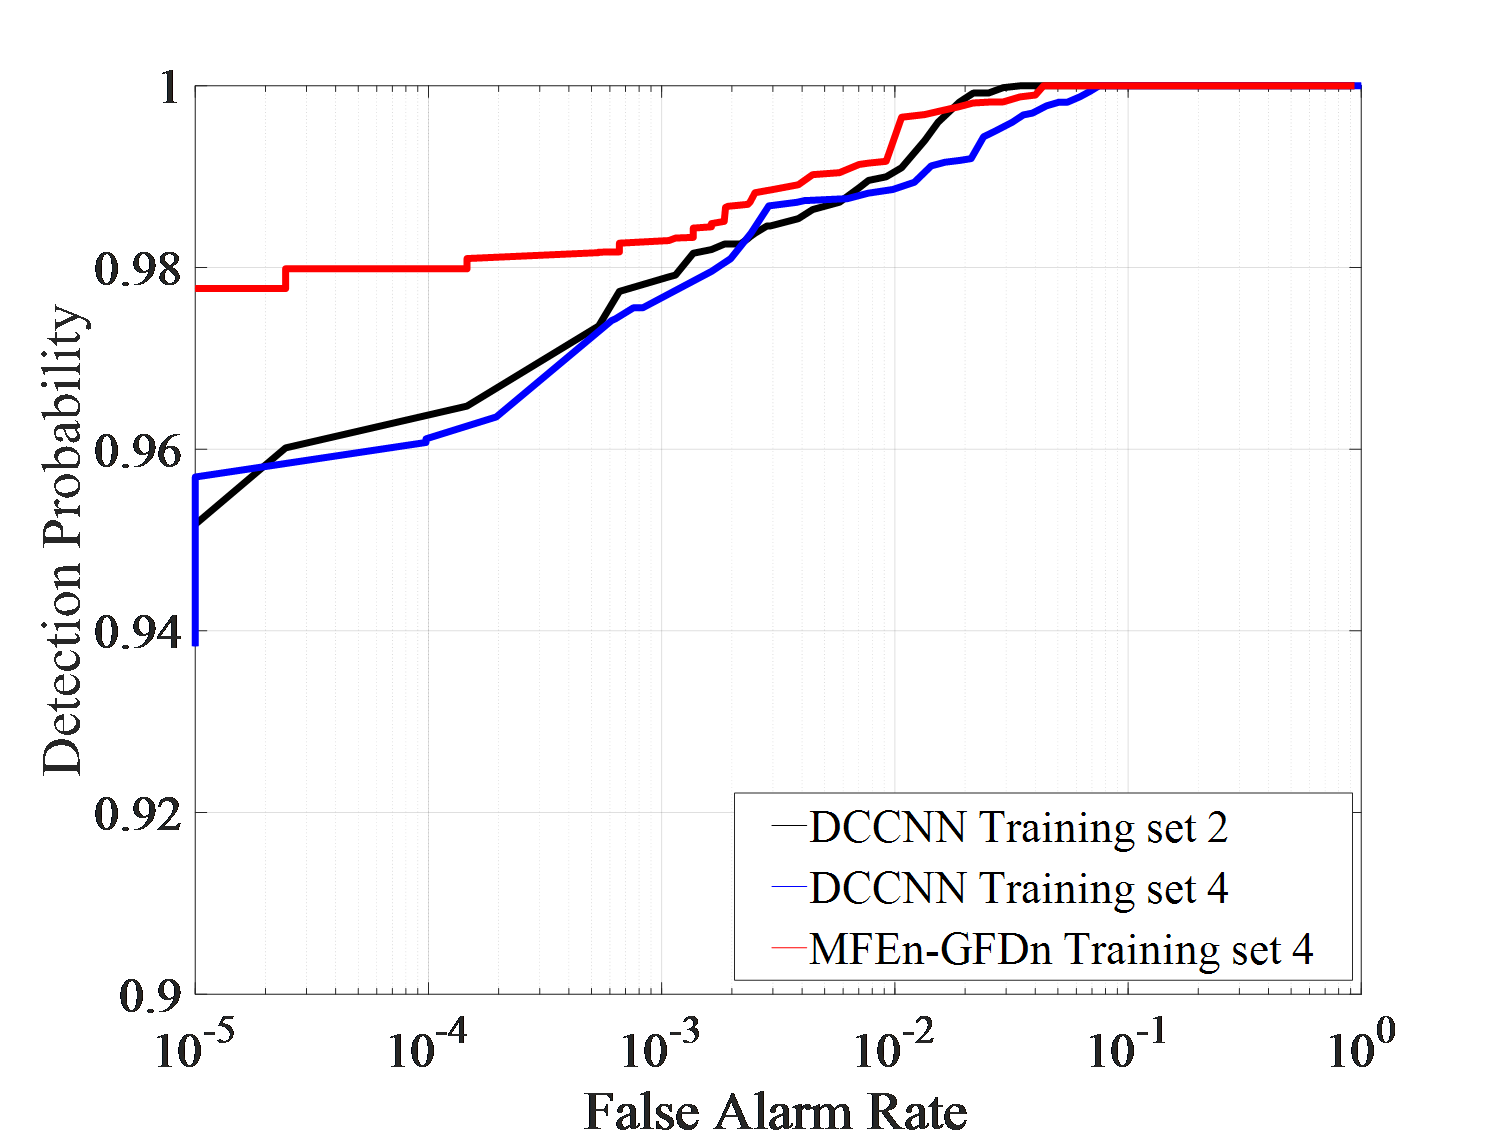
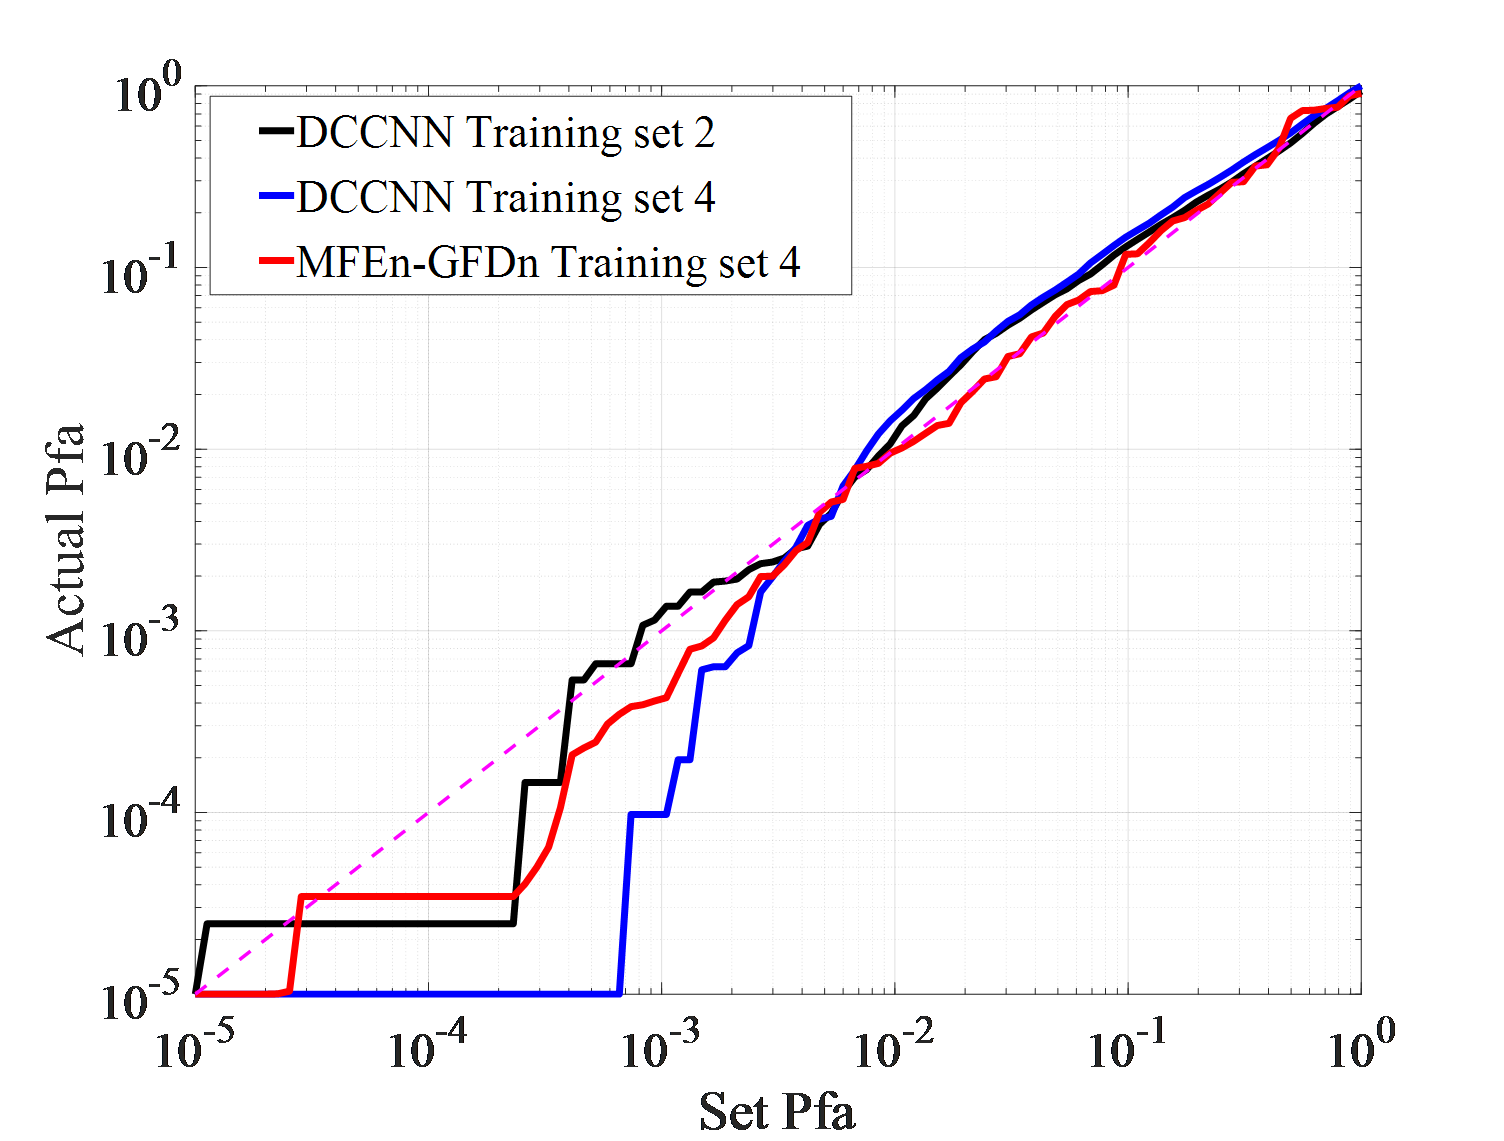
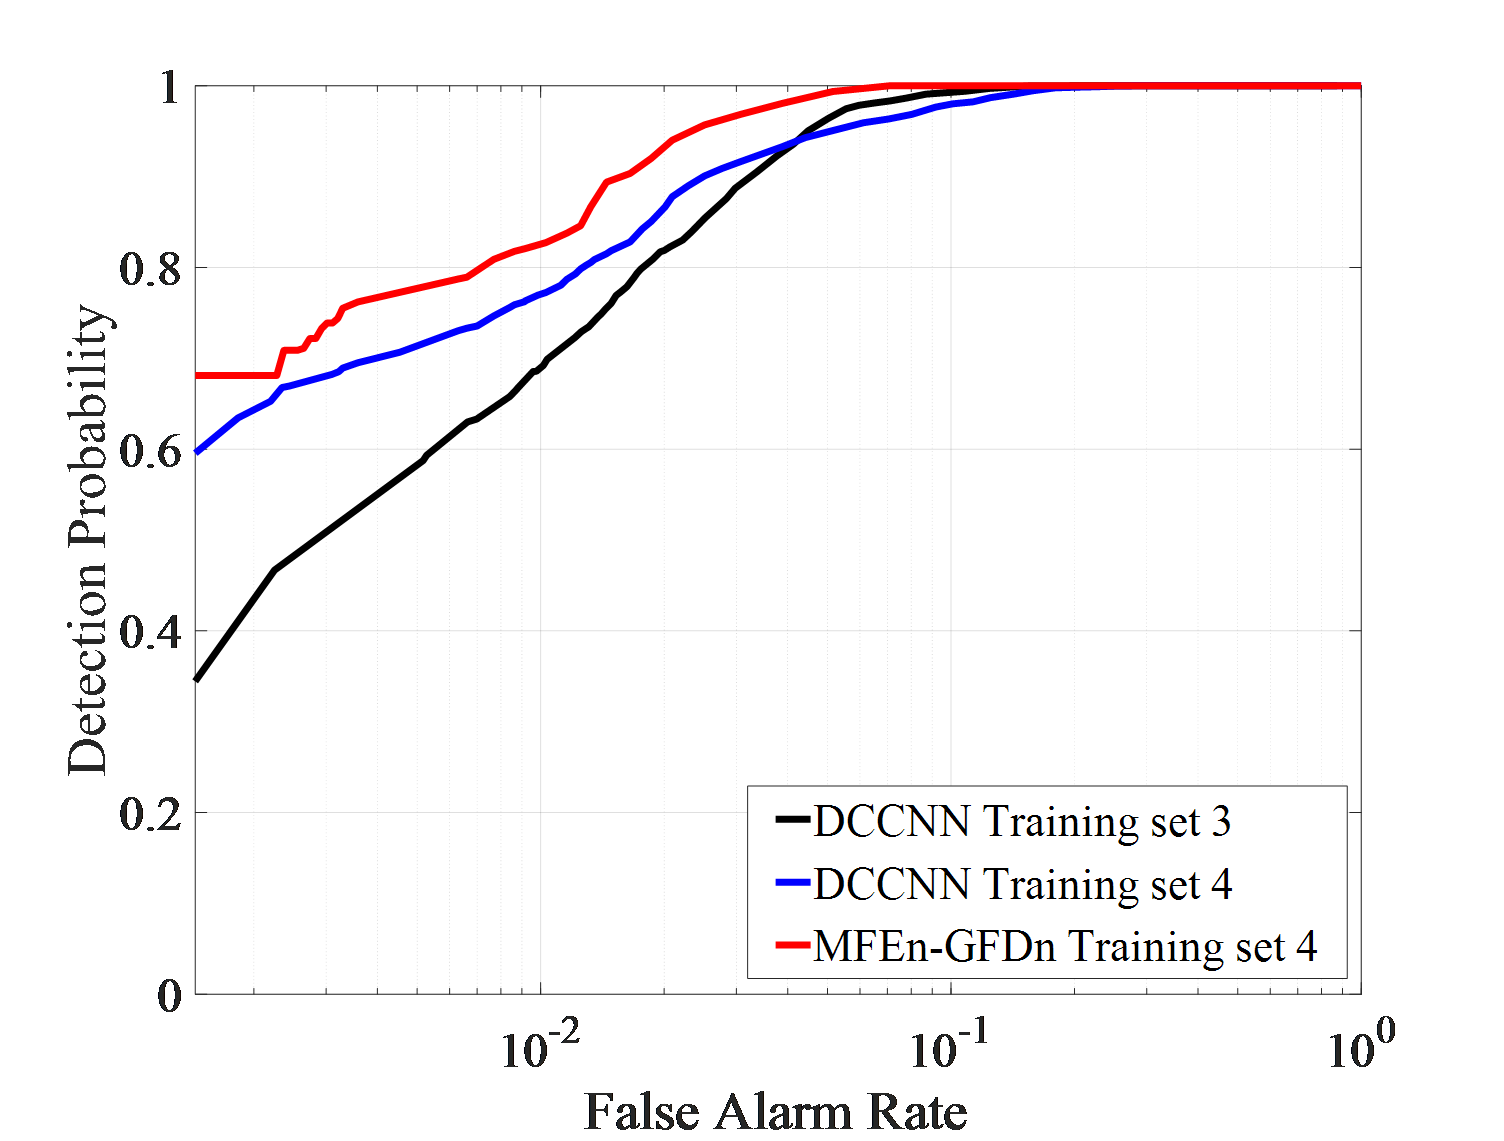
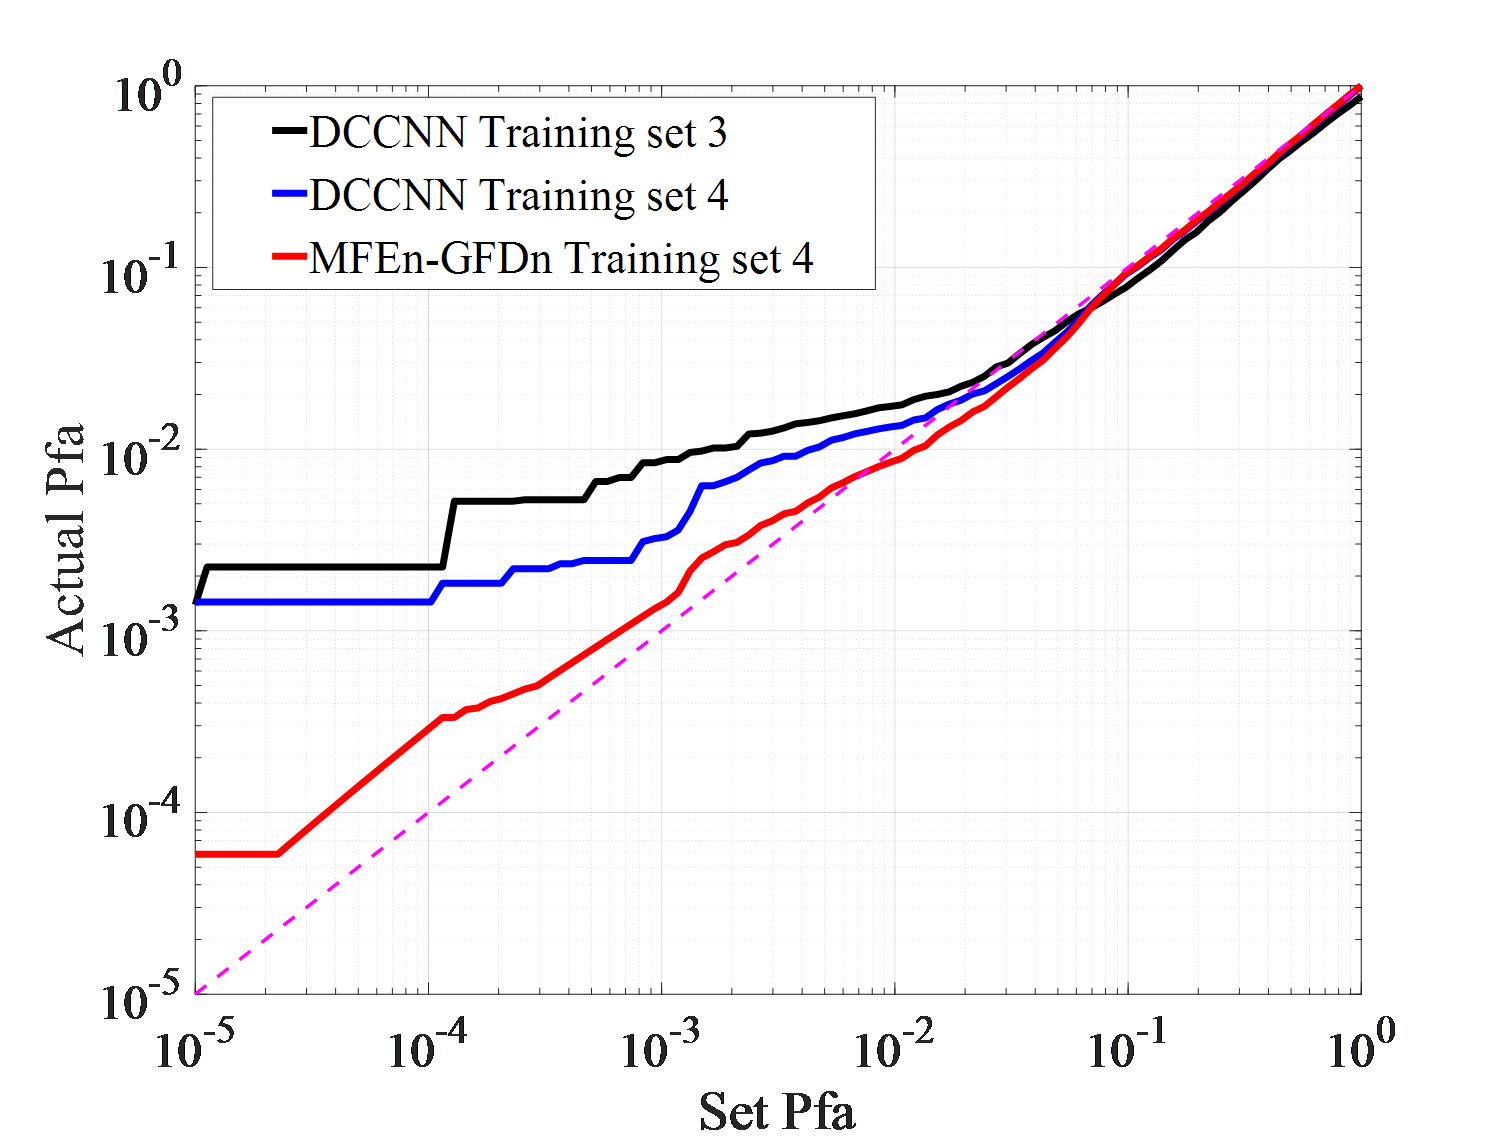
Dataset 1, 2, and 3 are composed of observation data from a single environment, Dataset 4 is composed of an equal mixture of sample from three different environments. And Dataset 5, 6, and 7 are composed of observation data from two different environments. DCCNN and MFEn-GFDn were trained on different training sets, and their detection performance was tested on three different test sets (IPIX01-03). The results are shown in Figure 6.
Firstly, the detection results of IPIX01 data are analyzed, as shown in Figure 6 (a). The detection performance curve reflects the separability and distribution of target and clutter. The closer it is to 0, the more likely the sample is clutter. The detection probabilities of DCCNN trained on two training sets, 1 and 4, are close. MFEn-GFDn exhibit higher detection probability than DCCNN on condition of low false alarms rate. It significantly improve the discrimination between targets and clutter near the target decision (detection value 1) in the detection result domain. Therefore, by expanding the types of features, the discrimination between targets and clutter can still be further improved. The false alarm loss curve reflects the adaptability of the model to clutter samples in the test set after optimizing the training set parameters. As shown in Figure 6 (b), the false alarm losses of MFEn GFDn and DCCNN are similar.
As shown in Figures 6 (c) and (d), in IPIX02 data testing experiment, the detection performance of different training sets and models is similar. High-performance detection can be achieved through the STFT features of amplitude and HH polarization data. The MFEn-GFDn method can further improve the discrimination between targets and clutter by expanding the types of features. In the DCCNN detection results obtained from training set 4, it can be found that, some clutter samples are firmly detected as targets, and the false alarm rate cannot be further reduced with the threshold controlled by the training samples. However, MFEn-GFDn can avoid this problem.
As shown in Figures 6 (e) (f) and Table 5, in the IPIX03 data testing experiment, the DCCNN trained with mixed data from training set 4 achieved significant improvement in detection performance compared to the single environment training set 3. And it effectively suppressed false alarm losses. Compared to DCCNN, MFEn-GFDn has a significant advantage in detection performance. It is worth noting that under the background of high sea state data in IPIX03, the false alarm loss is severe, and there are a large number of stable false alarms that are difficult to suppress in the detection results of DCCNN and MFEn-GFDn.
Expanding the training dataset is an effective way to improve the detection probability and generalization ability of data-driven detection methods. The effective utilization of information can further enhance the performance of the method.
| False alarm rate | Detection probability | |||
|---|---|---|---|---|
|
0.00224 | 0.467 | ||
|
0.00144 | 0.596 | ||
| MFEn-GFDn | 0.00144 | 0.681 |
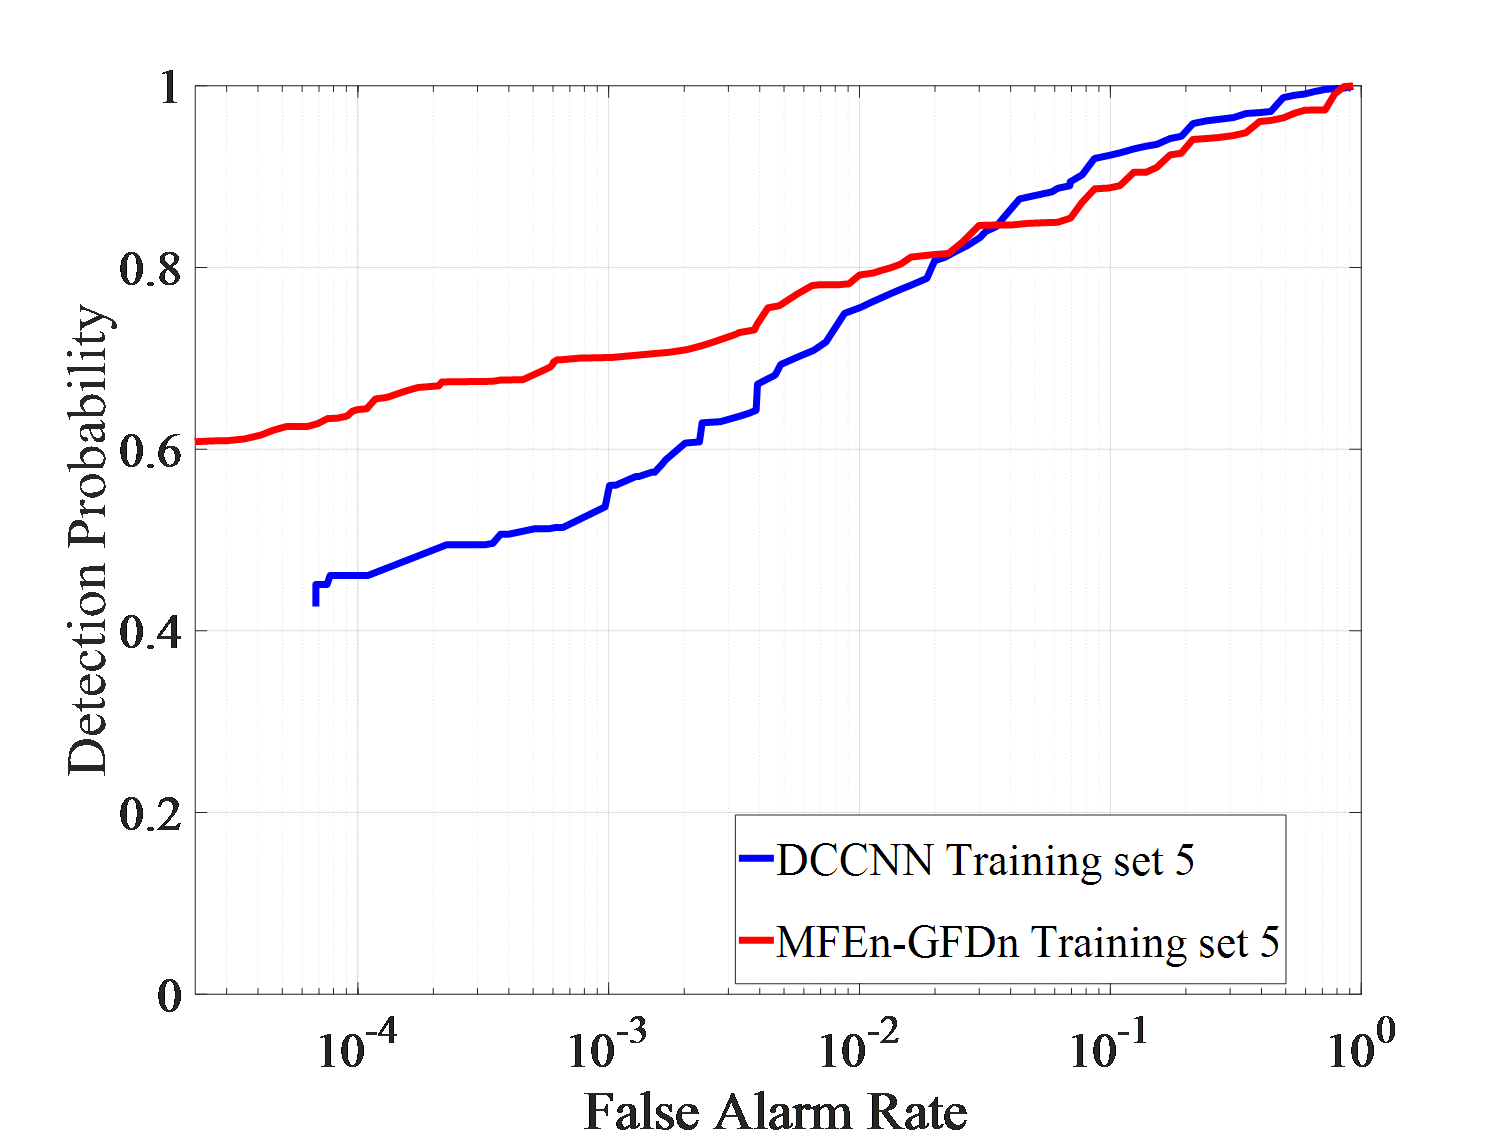
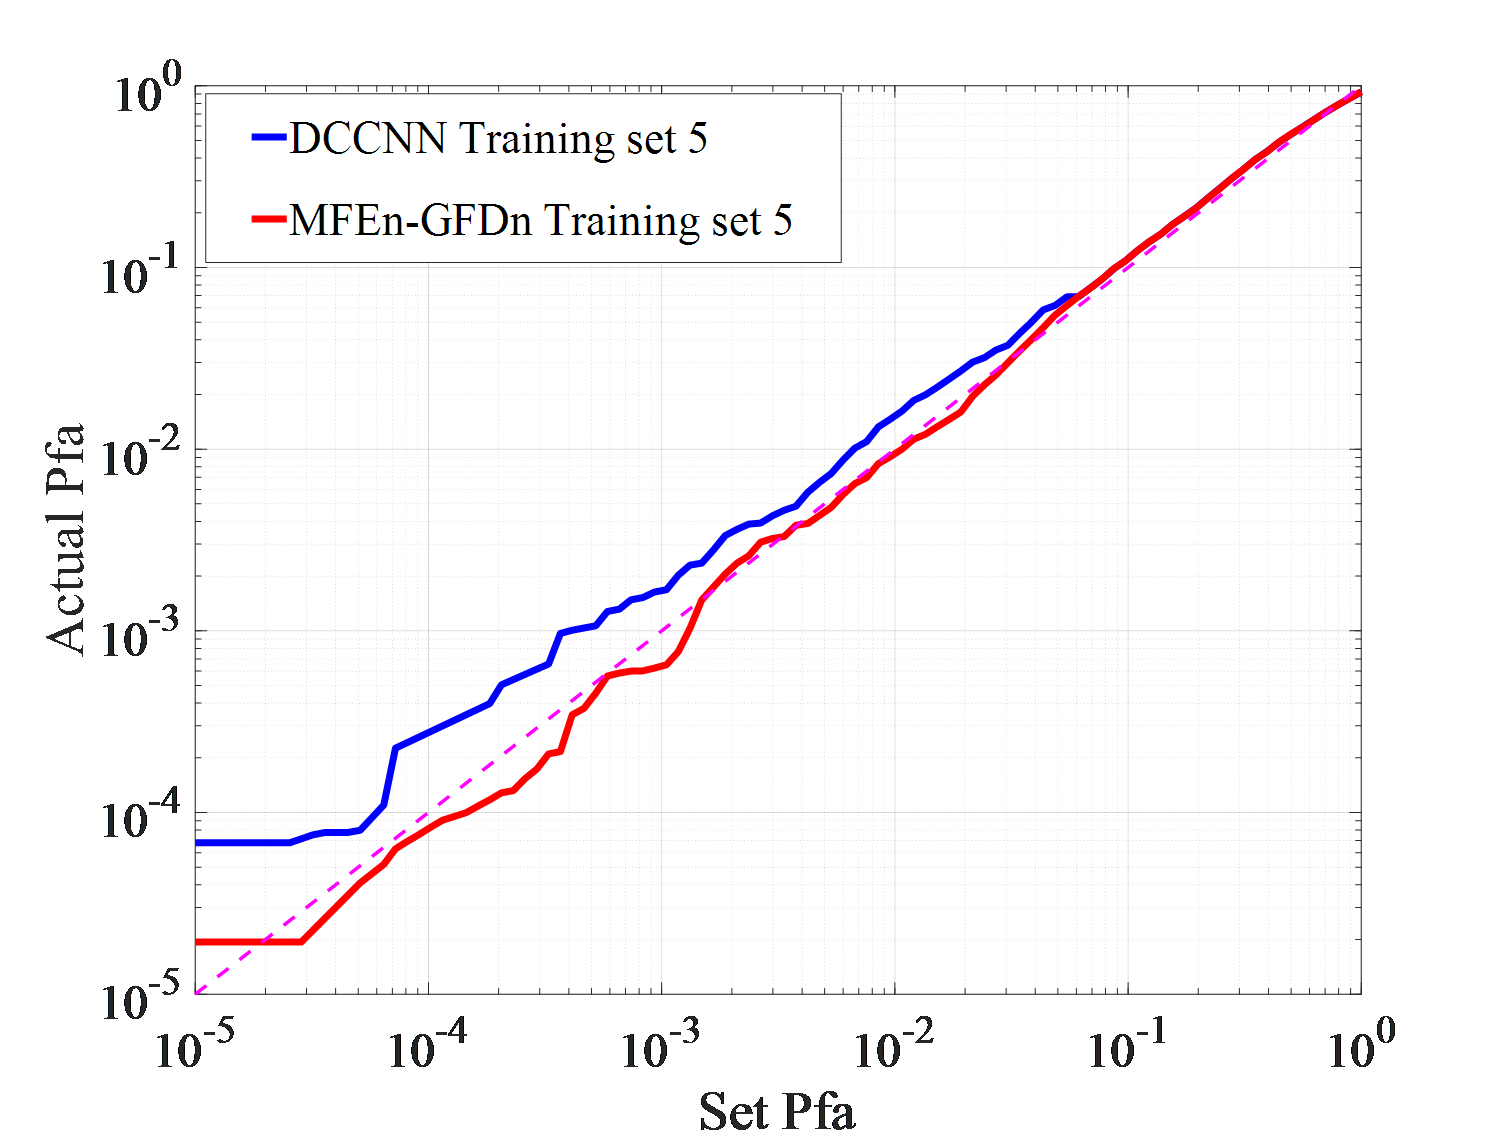
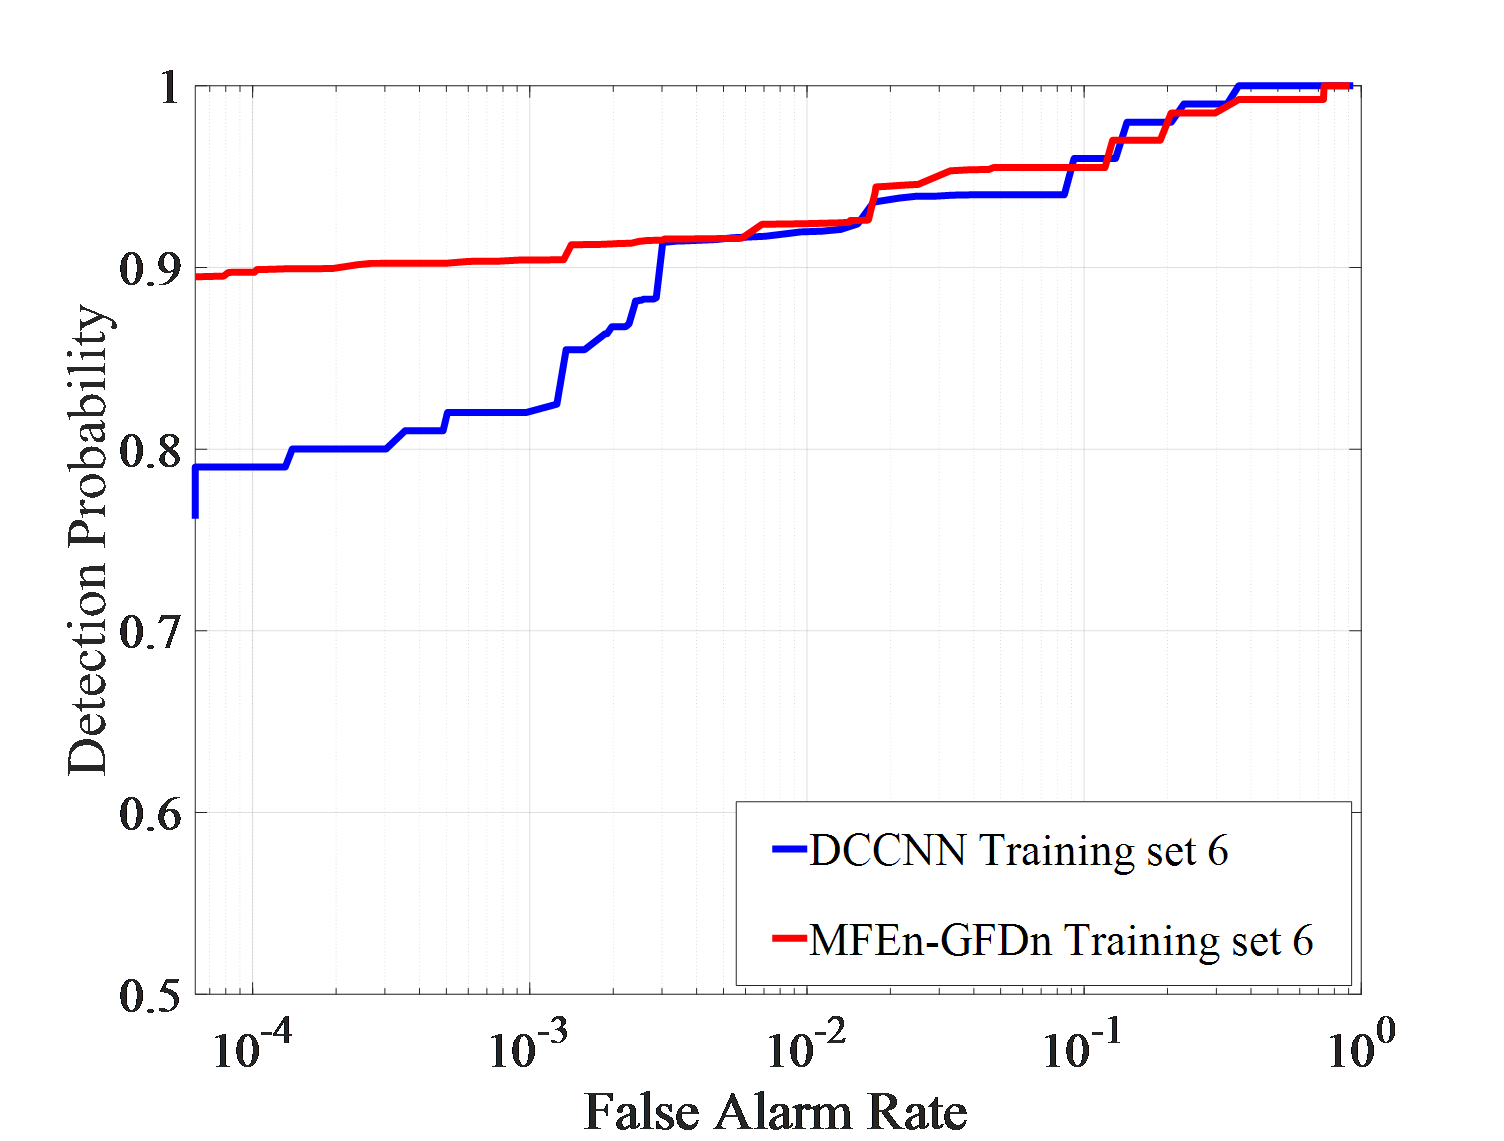
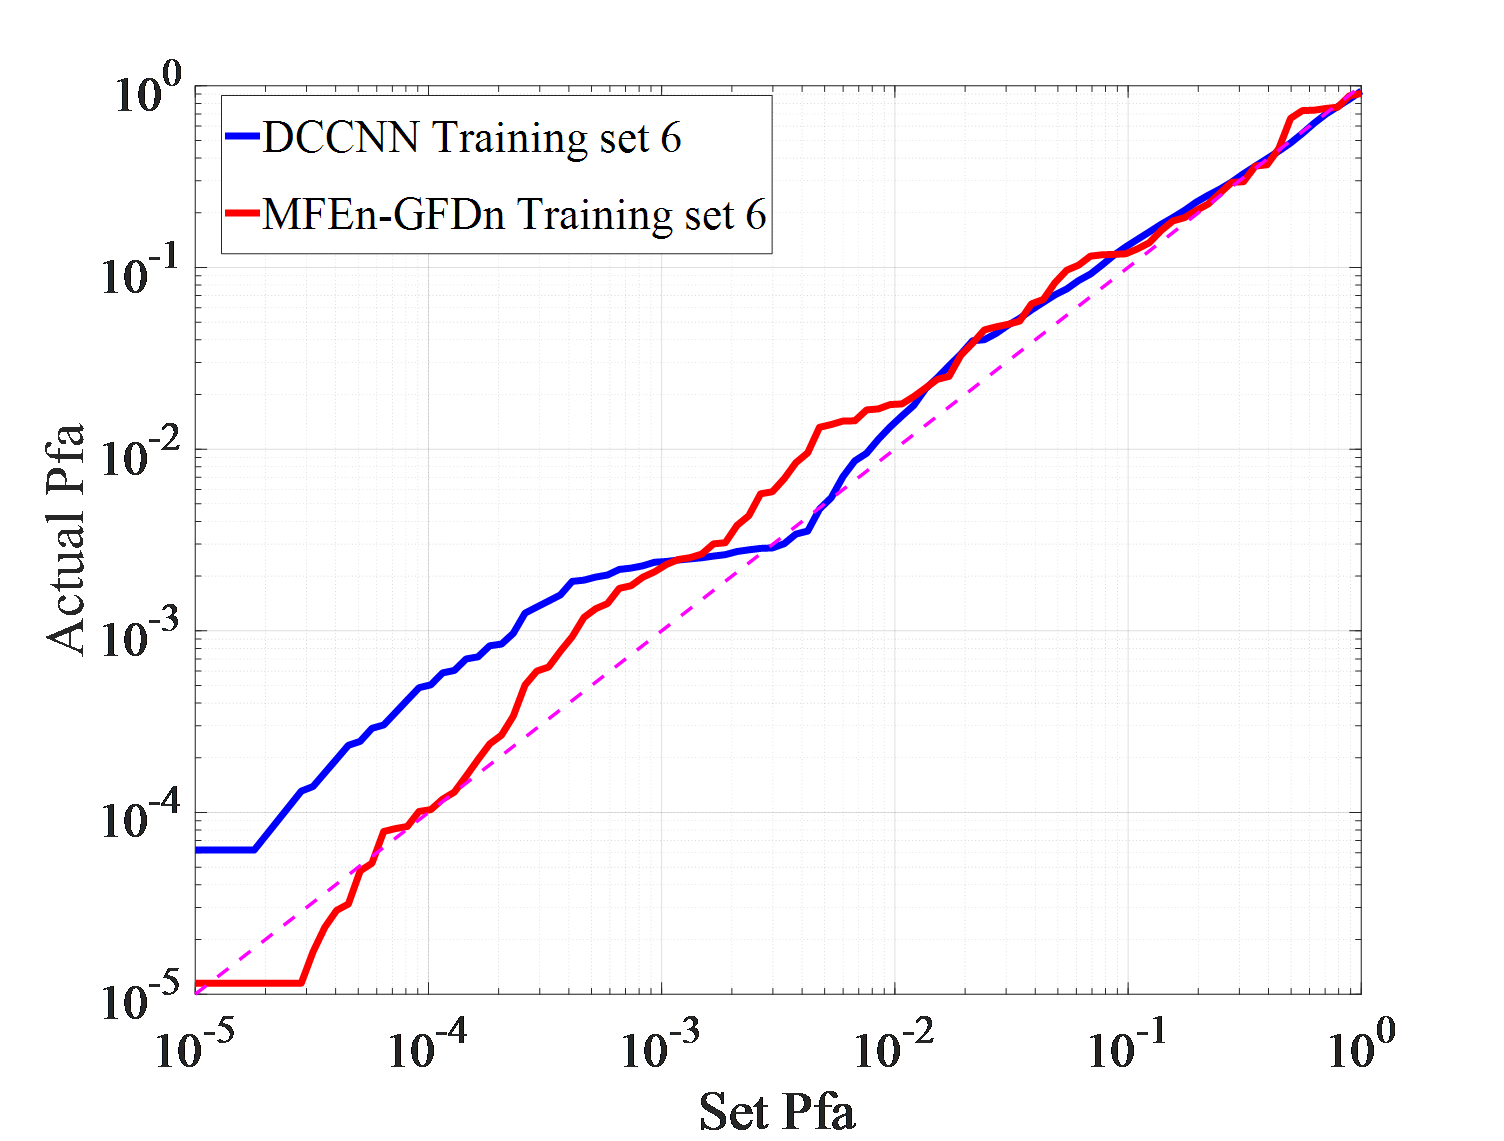
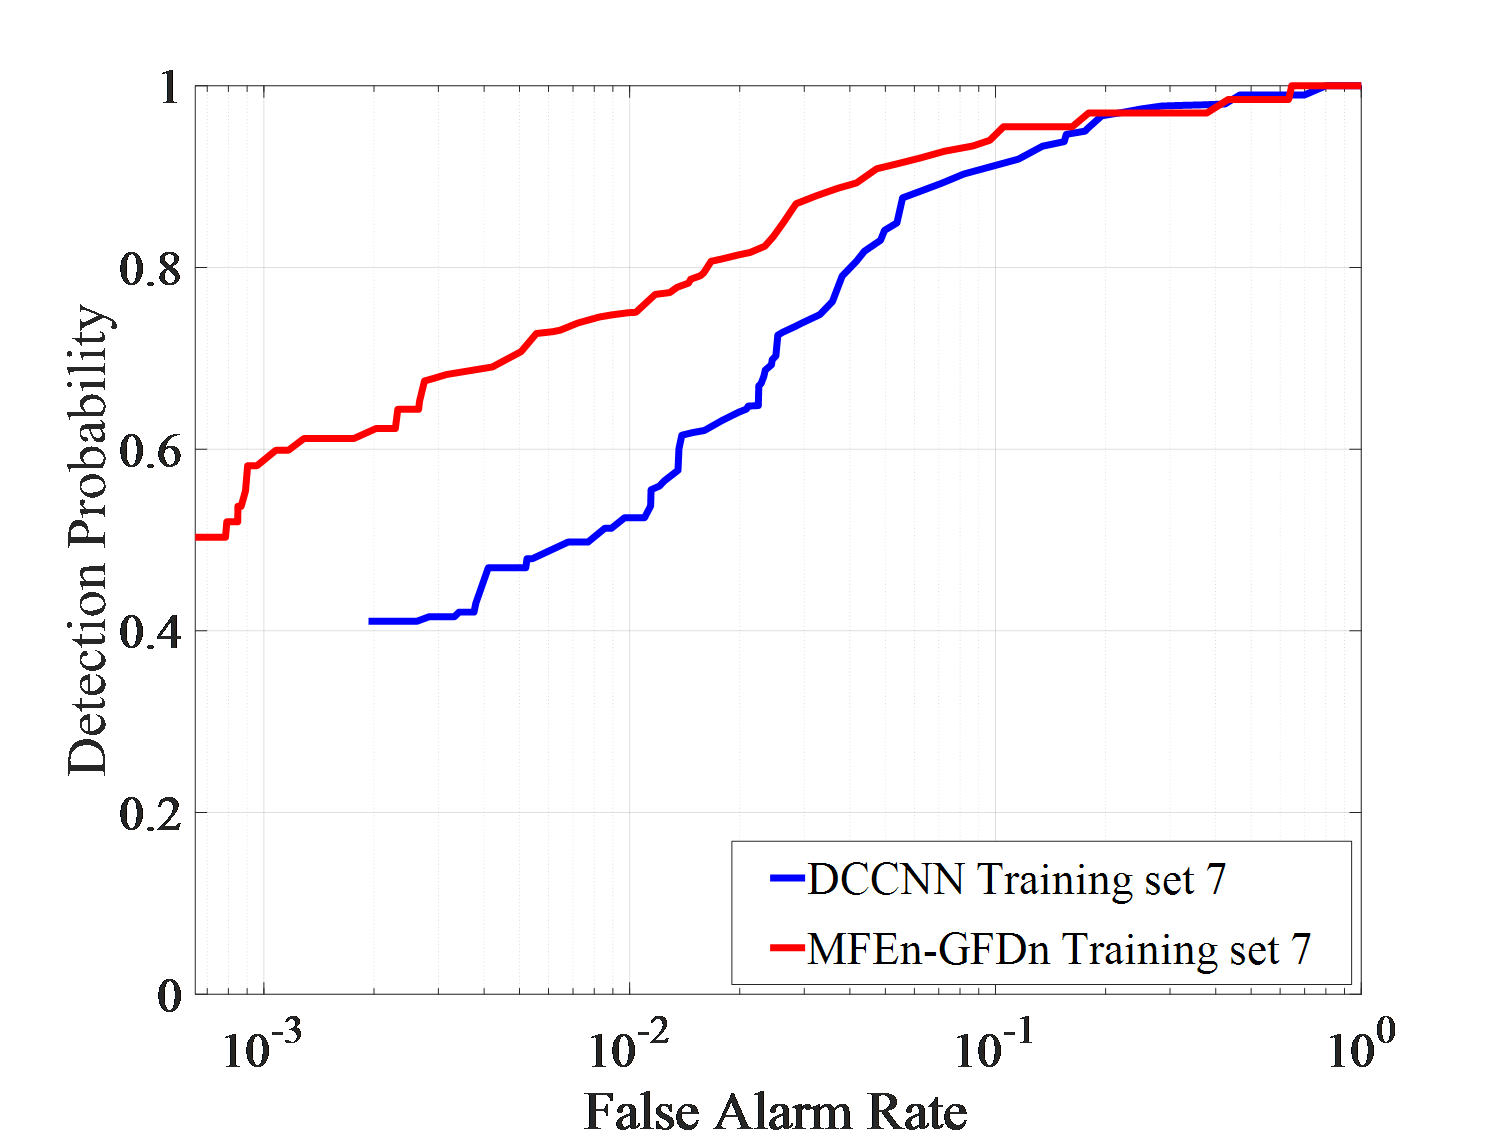
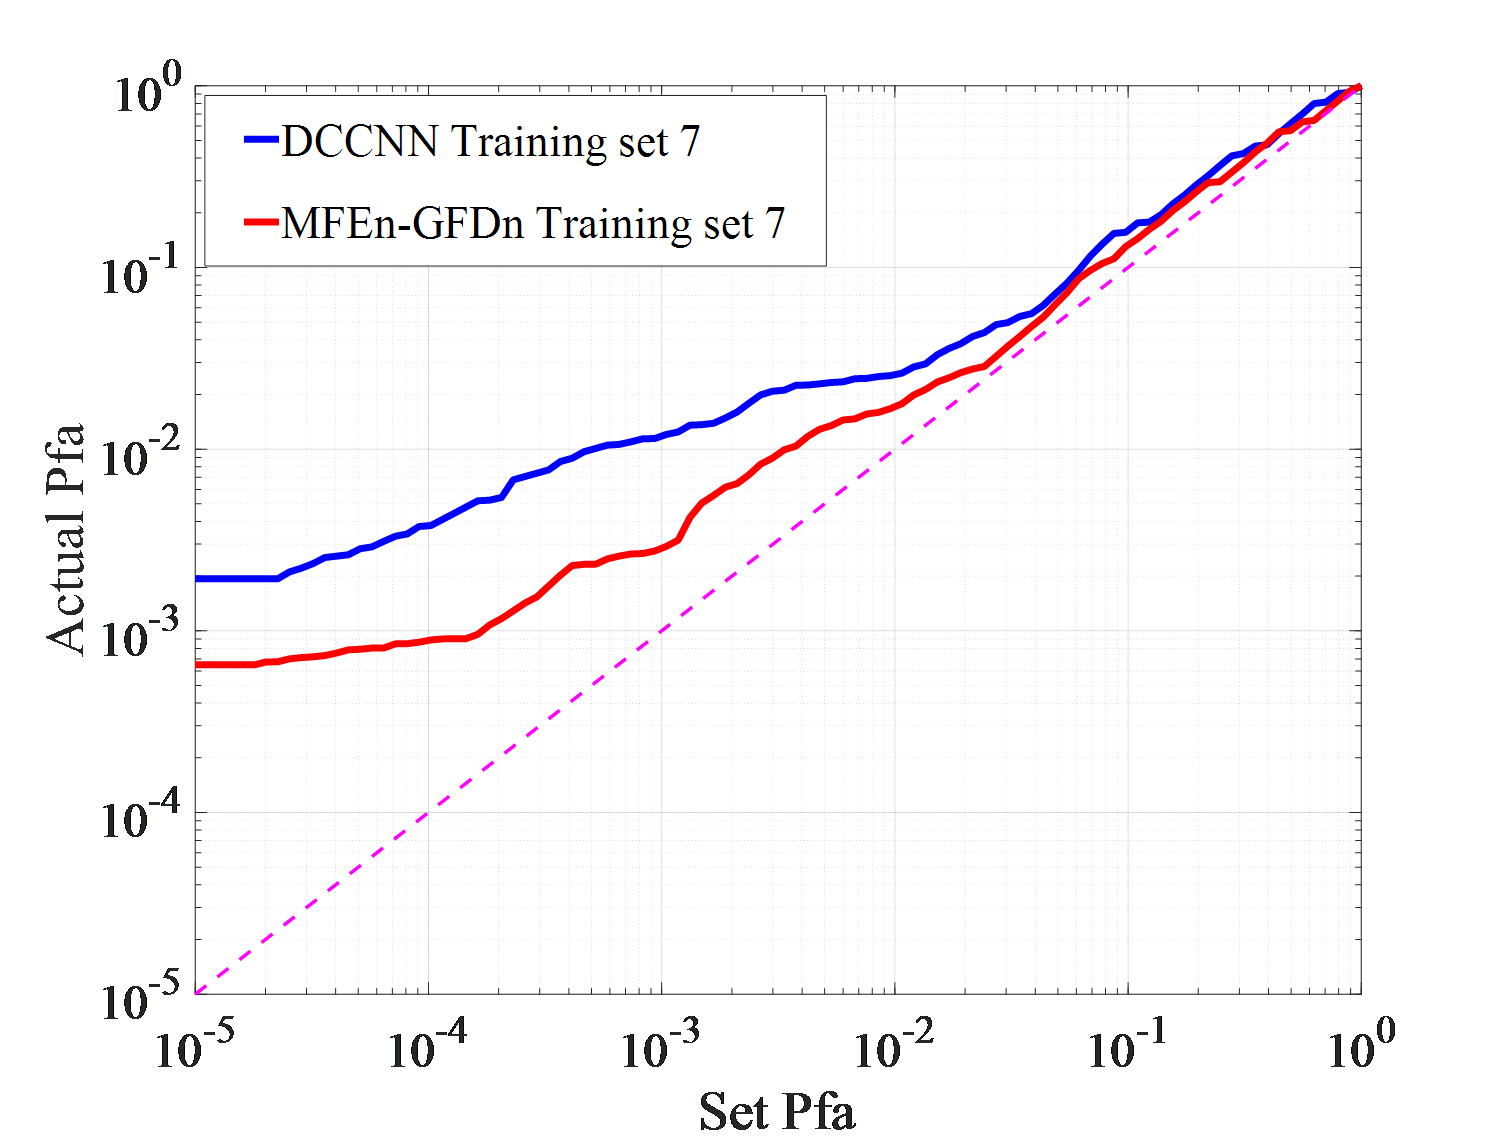
Under actual observation conditions, targets or environment may have not been observed in previous works, which stresses demands on the generalization ability of detection methods. Three detection experiments, with each set consisting of IPIX01-IPIX03 and corresponding training sets of 5, 6, and 7, are conducted to test DCCNN and MFEn-GFDn. The test results are shown in Figure 7.
| False alarm rate | Detection probability | |
|---|---|---|
| DCCNN | 0.00193 | 0.411 |
| MFEn-GFDn | 0.00176 | 0.612 |
As shown in Figure 7 (a)-(f), in the IPIX01-IPIX03 data testing experiment, MFEn-GFDn has a significant advantage in detection probability. However, due to the fact that the test samples and training samples come from data obtained in different environments, there are greater differences in features, resulting in a decrease in detection performance and significant false alarm losses for both methods on the three test sets. In the IPIX02 data testing experiment, the detection probability of DCCNN decreased significantly, as shown in Figure 7 (c) - (d). Compared with DCCNN, MFEn-GFDn method achieves higher detection probability and false alarm loss advantage for data with significant differences from the training set, but it is still difficult to completely avoid false alarm loss in some environments, as shown in Figure 7 (f) and Table 6. More types of model features can enhance the discrimination between targets and clutter samples, while MFEn avoids higher fitting of the training set by the network through self supervised training, alleviating the problem of reduced ability to distinguish unknown characteristic samples.
This paper addresses the problem of limited ability of single feature detection methods in distinguishing targets and backgrounds in complex sea clutter backgrounds. From the perspective of expanding the types of features and utilizing the complementarity between different features, an MFEn-GFDn feature fusion detection method is proposed. Multiple time-frequency maps of radar signals are extracted via CAE based MFEn to construct radar signal MFG. The MFG containing multiple feature information is then fused and detected using GFDn. In different environmental target detection experiments, expanding the dataset can significantly improve the model's generalization ability. The MFEn-GFDn trained on a training set composed of a mixture of three datasets has a detection probability increase of about 8% compared to DCCNN. In addition, MFEn-GFDn further improves detection performance by expanding feature dimensions, especially in environments lacking corresponding training samples, with higher generalization ability. In the actual sea detection experiment, the proposed method still requires more different sea state data for network training. But it may has higher performances in case of detection in new sea environments. At the same time, the proposed method is of higher computational complexity, due to more time-frequency features extraction.
 Copyright © 2025 by the Author(s). Published by Institute of Emerging and Computer Engineers. This article is an open access article distributed under the terms and conditions of the Creative Commons Attribution (CC BY) license (https://creativecommons.org/licenses/by/4.0/), which permits use, sharing, adaptation, distribution and reproduction in any medium or format, as long as you give appropriate credit to the original author(s) and the source, provide a link to the Creative Commons licence, and indicate if changes were made.
 Chinese Journal of Information Fusion
ISSN: 2998-3371 (Online) | ISSN: 2998-3363 (Print)
Email: fusion001@csif.org.cn

Portico
All published articles are preserved here permanently:
https://www.portico.org/publishers/iece/