


Chinese Journal of Information Fusion
ISSN: 2998-3371 (Online) | ISSN: 2998-3363 (Print)
Email: [email protected]

Optical remote sensing images [1] find applications in numerous fields and hold great value in public and agricultural sectors. From a public perspective, remote sensing image data can be utilized for weather prediction [2, 3], disaster prevention [4], and traffic monitoring [5, 6]. In the global agricultural production and food supply domain, these images have proven valuable in various applications such as farmland forecasting [7, 8], crop identification [9, 10, 11], supply transportation positioning [12], pest and disaster prevention [13, 14], ecological and trade protection [15], and more. Taking into consideration the utilization of transportation positioning technology in the realm of food supply, its application is mainly motivated by the intricacy and magnitude of global food trade. As the food supply chain becomes increasingly globalized, food production, processing, transportation, and sales involve numerous cross-national links. Transportation vehicle positioning technology offers real-time location data, empowering managers to closely monitor the movement of goods within the supply chain and guarantee the safety and quality of food throughout the entire process. Simultaneously, vehicle positioning and remote sensing image technology provide a more comprehensive perspective for food supply chain management. Remote sensing images enable the surveillance of expansive geographical regions, with the detection of small targets becoming particularly crucial in this setting as small transport vehicles within the food supply chain, warehouses, or specific areas in farmland can potentially serve as risk points. By implementing small target detection in remote sensing images, the system can promptly identify these diminutive targets, thereby fortifying the monitoring and management of potential issues. Consequently, the amalgamation of vehicle positioning technology and remote sensing image technology presents an efficient mechanism for tracking the food supply chain, fostering enhanced transparency, mitigating risks, averting food safety concerns, and ultimately delivering consumers with more secure and trustworthy food-related information. Furthermore, this offers superior management and monitoring approaches for the global food industry and propels the development of the food supply chain towards a more sustainable and secure trajectory.
However, accurately detecting small and densely packed objects in remote sensing images remains a persistent challenge due to factors such as complex backgrounds, varying object scales, and occlusions. Although recent advancements in deep learning have significantly improved object detection performance, existing models still face low recall rates and false detections in dense object scenarios. In particular, the trade-off between detection accuracy and real-time processing remains a critical limitation, as models with high precision often suffer from excessive computational overhead, making them impractical for real-world applications such as food supply monitoring. Addressing these challenges requires a model that can effectively balance detection performance, robustness to occlusion, and inference speed while maintaining suitability for small object detection in complex environments.
According to the image classification, remote sensing images are provided by satellite remote sensing images (RSIs) and airborne remote sensing images (ARSIs), which cover large area coverage, target diversity, target density, and complex background. RSIs captured by satellites [16] offer a wide coverage of various types of targets, including forests, deserts, cities, and farmland, showcasing complex terrain and diverse land use patterns. ARSIs obtained from aircraft yield higher-resolution images, revealing rich diversity in targets and density, such as densely packed buildings, road networks in urban areas, and lush crops in agricultural lands. Urban RSIs exhibit complex backgrounds due to numerous human-made structures, including buildings, roads, vehicles, and shadows, reflections, and occlusions. Agronomy RSIs demonstrate dense targets in trees and vegetation alongside complex background features, such as terrain variations and tree canopies. Similarly, marine RSIs encompass vast oceanic areas featuring diverse targets, including marine life, tides, and ocean currents, while showcasing complex backgrounds with waves, cloud cover, and variations in ocean color.
Traditional remote sensing image detection methods can be broadly categorized into four groups: template matching-based methods [17], shape-texture-based methods [18], image segmentation-based methods [19], and visual saliency-based methods [20]. These methods typically involve constructing a general target template, performing global image matching or segmenting potential target regions, and using simple feature rules for discrimination. However, these traditional methods often produce many error examples, resulting in low detection accuracy and limited applicability, as they can only detect targets in simple and uniform backgrounds.
With the exponential growth of data and advancements in hardware computing capabilities, deep learning theory and technology has rapidly progressed, leading to the application of various deep learning methods in remote sensing image target detection. Deep learning-based object detection algorithms can be classified into two main categories: two-stage algorithms [21] and one-stage algorithms. Two-stage detectors, such as Faster R-CNN [22], Libra R-CNN [23], and Mask R-CNN [24], employ a region proposal network (RPN) to extract candidate regions, achieving high accuracy but at the cost of computational efficiency. On the other hand, one-stage detectors, including the YOLO series [25, 26, 27, 28], SSD [29], and FCOS [30], directly predict bounding boxes, offering superior inference speed but struggling with small object detection due to inadequate feature representation.
Recent advances have introduced several improvements to address these limitations. YOLOv8 [31] enhances detection precision by incorporating a more robust anchor-free detection head and dynamic label assignment. RT-DETR [32] integrates transformer-based modules to improve contextual feature aggregation, significantly boosting performance in cluttered environments. Transformer-based models such as Swin Transformer [33] and DINO [34] further enhance long-range dependencies and global feature extraction, achieving state-of-the-art performance in many benchmarks. However, these models require significantly higher computational resources, making them unsuitable for real-time or edge-computing applications.
In general, deep learning-based methods automatically acquire deep semantic features of images through training, possessing stronger expressive abilities than manually designed features. These methods are also more sensitive to spatial and dense object distributions in the image but less sensitive to object categories. Therefore, deep learning-based approaches can detect multiple types of targets, aligning better with practical applications of remote sensing images. As a result, they have become the mainstream direction for developing remote sensing image target detection.
Despite these advancements, detecting small and dense objects in complex remote sensing imagery remains an open challenge. Many recent methods still exhibit low recall rates and false positives when handling highly dense targets with strong background interference. Moreover, existing solutions fail to maintain real-time inference speeds while ensuring high accuracy. This research seeks to address these gaps by designing a novel architecture that enhances detection precision for small and occluded targets while optimizing computational efficiency.
More recently, several state-of-the-art (SOTA) object detection models have been developed to improve detection performance across various domains. While approaches such as YOLOv8, RT-DETR, and Swin Transformer introduce significant enhancements in feature extraction, object localization, and contextual learning, their application to dense small target detection in remote sensing remains challenging. Transformer-based architectures often demand substantial computational resources, making real-time applications difficult. Meanwhile, YOLOv8, despite its improvements in detection accuracy, does not explicitly optimize for highly dense small objects in high-resolution imagery. These challenges underscore the need for further advancements in small target detection within remote sensing applications, balancing detection accuracy and computational efficiency.
Over the past few years, the remote sensing image detection field has experienced substantial advancements in detection accuracy and efficiency. Several notable studies have contributed to these improvements. For instance, Li et al. [35] proposed a dual-channel feature fusion network that effectively detects objects in remote sensing images by learning local and contextual attribute features along two independent paths. Yang et al. [36] introduced an end-to-end object detection algorithm incorporating rotating detection frames, improving ship detection accuracy. Zhang et al. [37] designed a multi-scale detection network based on the YOLOv5s model, which enhanced target detection performance in surveillance scenarios.
Other researchers have proposed innovative techniques to address specific challenges in remote sensing image detection. Jiang et al. [38] combined a bijective neural network with a dislocation localization strategy to address the issue of narrow bounding boxes for small remote sensing targets. Wang et al. [39] established dense connections between shallow and deep feature maps, tackling the problem of large-scale changes in ship detection. Yang et al. [40] improved sensitivity to small objects by fusing multi-layer features with effective anchor point sampling. Yao et al. [41] introduced an expanded bottleneck structure in the feature pyramid network to generate high-quality semantic features. Yan et al. [42] preserved precise position information of weak and small targets through cross-level channel feature fusion, enhancing small target detection. Li et al. [43] used a novel dual-branch regression network to independently predict orientation and other variables. In order to overcome the limitations of conventional region-of-interest pooling on ship targets of different sizes, an adaptive shape pooling method is proposed. At the same time, the fusion of multi-level features is more suitable for simultaneous ship classification and positioning through spatially variable adaptive pooling, which solves the multi-scale problem of ship targets.
The aforementioned methods show that the scale variation of targets in remote sensing images is significant, particularly in the detection performance of small targets, which remains an area of concern. In particular, dense small targets may suffer from missed detection and inaccurate bounding boxes, resulting in limited detection accuracy and imprecise target localization. The attention mechanism has shown great potential in addressing the problem of detecting objects at different scales in remote sensing images. By weighting input features, this mechanism effectively focuses the model’s attention on the most important areas, enhancing accuracy and performance in remote sensing image processing tasks. The early formulation of the attention mechanism involved calculating the correlation between the Query, Key, and Value and obtaining attention scores. The scores were then scaled, normalized, and used to weigh and aggregate the Values, thus directing attention to key regions while disregarding irrelevant areas.
Vaswani et al. [44] pioneered the application of the self-attention mechanism in natural language processing, successfully introducing it into computer vision. This demonstrated the substantial potential of self-attention models. In contrast to conventional attention mechanisms, self-attention diminishes its dependence on external information and excels at capturing intrinsic relationships within data or features. The pivotal element of self-attention is rooted in the Query, Key, and Value variables being either identical or stemming from the same source variable, denoted as X. By discerning salient aspects within X using X itself, the self-attention mechanism facilitates an enhanced concentration on crucial information while disregarding less noteworthy particulars.
However, the traditional self-attention mechanism employed for global context modeling, such as vanilla attention, calculates the relationships between feature pairs across all spatial positions, leading to substantial computational and memory demands, particularly when handling high-resolution inputs. Recent research has focused on alleviating the computational burden associated with self-attention modules to overcome this challenge. Various handcrafted sparse patterns, including local attention [45], axial stripe [46], and dilated window [47], have been introduced to reduce computational complexity. These patterns accomplish this by diminishing the count of key/value tokens through various merging or selection methods. However, these approaches come with the drawback of distributing a restricted set of key/value tokens among all queries in the image, which impedes efficiency.
In summary, although attention mechanisms enhance remote sensing image processing, the existing sparse patterns have limitations and may not be effectively suited for smaller, denser remote sensing imagery. Moreover, sharing key/value tokens can lead to efficiency issues. Consequently, this paper aims to leverage the attention mechanism to address these challenges and enhance the accuracy and performance of detecting objects at different scales in remote sensing imagery.
In food supply applications, efficient real-time detection of small and densely packed objects is essential to ensure effective monitoring and timely interventions. However, despite recent progress in deep learning-based object detection, most existing models still exhibit significant limitations in detecting small, occluded, and cluttered objects in remote sensing imagery. Specifically, YOLOv8 and RT-DETR, while improving detection accuracy, still struggle with highly occluded objects in aerial and satellite images, leading to reduced recall rates [48]. Transformer-based models such as Swin Transformer and DINO provide enhanced feature aggregation but suffer from high computational overhead, limiting their feasibility for real-time deployment [49]. Furthermore, current loss functions in bounding box regression remain suboptimal for dense small objects, often leading to inaccurate localization [50].
To address these issues, we propose YOLOv7-bw, an enhanced YOLOv7 architecture explicitly designed for dense small-object detection in remote sensing images. Recent advancements in object detection, including models such as YOLOv8 and RT-DETR, have achieved impressive results in certain domains. However, these models often face limitations in detecting small, clustered, and occluded objects in remote sensing images. By integrating targeted improvements—such as a Bi-level Routing Attention (BRA) module with query-aware mechanisms, a dynamic bounding box regression loss (WIoUv3) [51], and Deformable Convolutional Networks v2 (DCNv2) [52]—YOLOv7-bw significantly enhances detection accuracy for small, clustered, and occluded objects. These enhancements enable YOLOv7-bw to achieve superior performance in detecting small, clustered, and occluded objects in complex scenes, while maintaining real-time performance suitable for practical applications such as food supply monitoring, precision agriculture, and transportation logistics.
Additionally, YOLOv7-bw addresses several practical challenges specific to remote sensing applications. The WIoUv3 loss function, for example, effectively resolves difficulties posed by long shooting distances and blurred targets commonly encountered in agricultural monitoring. Meanwhile, the BRA self-attention module enhances the network’s ability to concentrate on dense target regions, directly mitigating the shortcomings of conventional detection algorithms. Lastly, the adoption of DCNv2 within the backbone ensures robust feature extraction across varied object shapes and sizes. Collectively, these design choices contribute to a more accurate and efficient detector tailored to real-world remote sensing demands.
Subsequent chapters of this paper are organized as follows: Section 2 expounds on the general architecture of the model and describes the process details. Then, Section 3 presents the experimental results and analysis. Finally, the conclusions of this study are summarized, and future research is discussed in Section 4.
This paper proposes a method for predicting dense and blurred object instances in remote sensing images. We first explain how our proposed structure generates prediction results for a given remote sensing image. Next, we discuss the improvements we made to the original YOLOv7 structure. The modifications made to each module of the framework are detailed as follows.
To mitigate overfitting, we monitor both training and validation performance. We applied Dropout and L2 regularization during training, and utilized data augmentation techniques to improve generalization. This helps ensure that the model does not overfit to the training data.
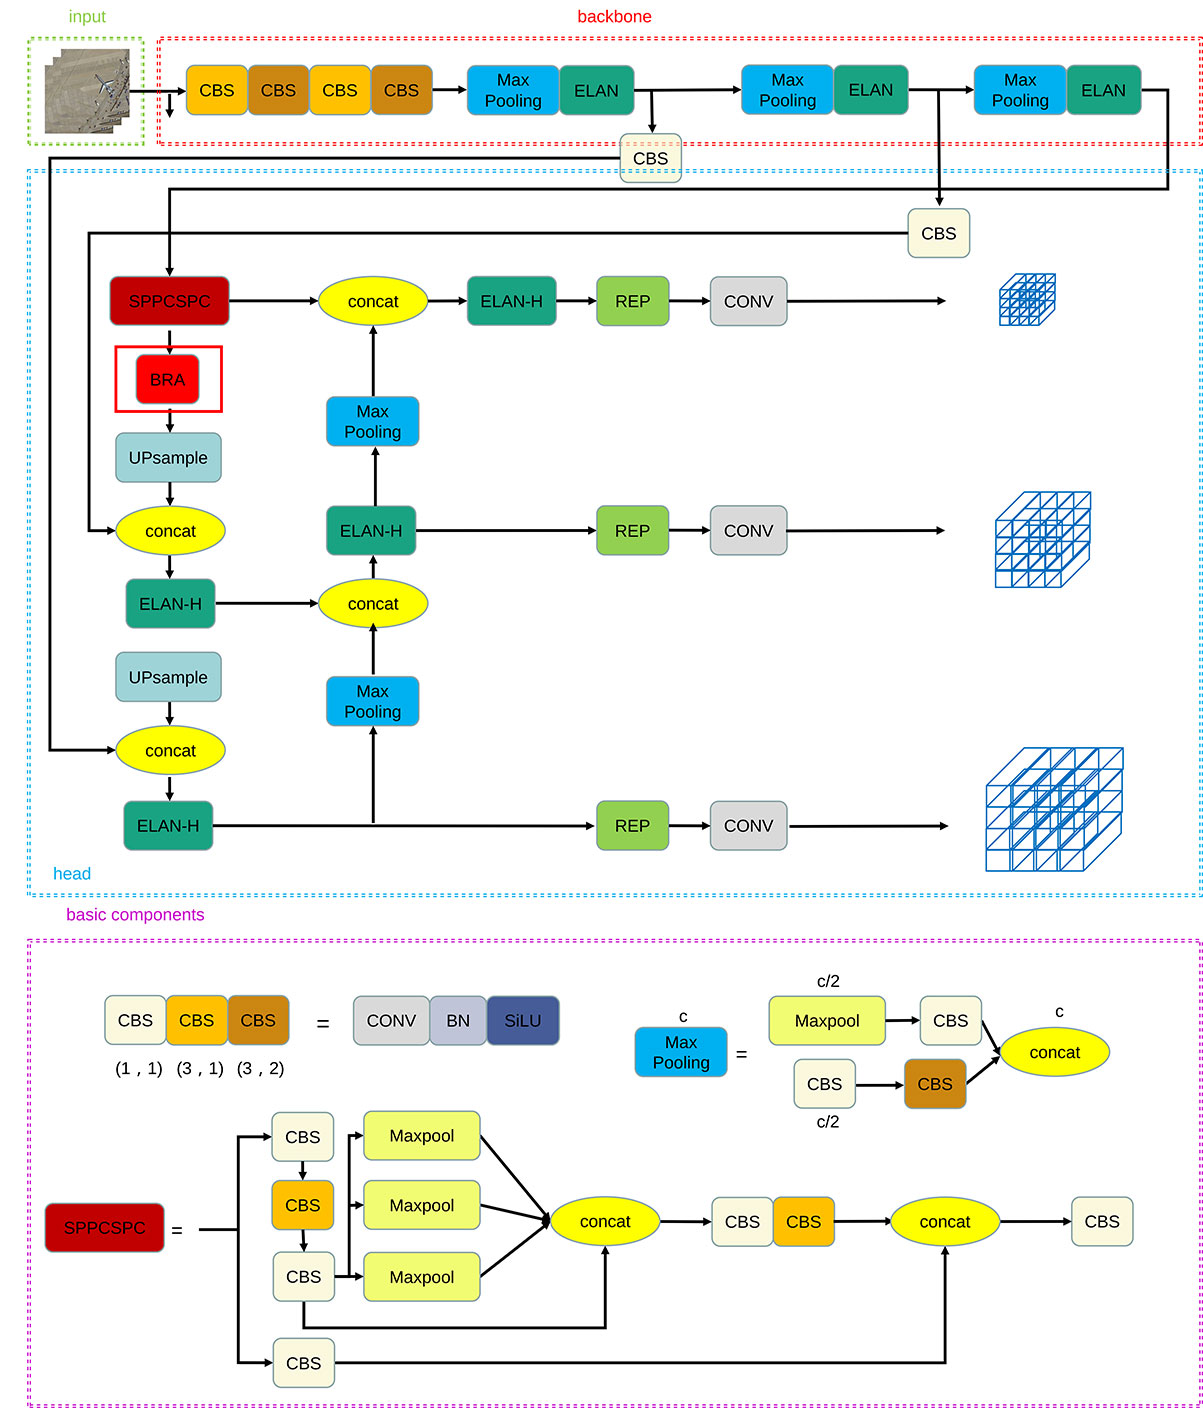
The overall architecture of our proposed object detection method is illustrated in Figure 1, where the purple dotted box highlights some basic modules within the architecture, providing a detailed representation of their specific functions. The ELAN module and BRA module within the overall structure will be explained in detail in Sections 2.2 and 2.3. Initially, an input remote sensing image is resized to a size of 640x640. It is then fed into the backbone network, where image features are extracted using the Elan module. The Head network generates three layers of feature maps with different sizes, corresponding to large, medium, and small targets. Subsequently, the prediction results are obtained through the Rep and Conv processes, which involve the fusion of multi-scale features to enhance detection accuracy. Finally, we modify the network’s weights by comparing the predicted bounding boxes with the ground truth boxes using a loss function. This iterative process is repeated until the final prediction result is obtained. The CBS modules of three colors correspond to the convolution basic units of the different convolution kernels and strides and consist of convolution, batch normalization, and SiLU activation functions. SPPCSPC is a spatial pooling pyramid composed of convolution and max pooling. Its main function is to avoid image distortion caused by cropping and zooming operations on the image area. At the same time, it solves the problem of repeated feature extraction of convolutional neural networks, which greatly improves the speed of generating region proposals and saves computational costs.
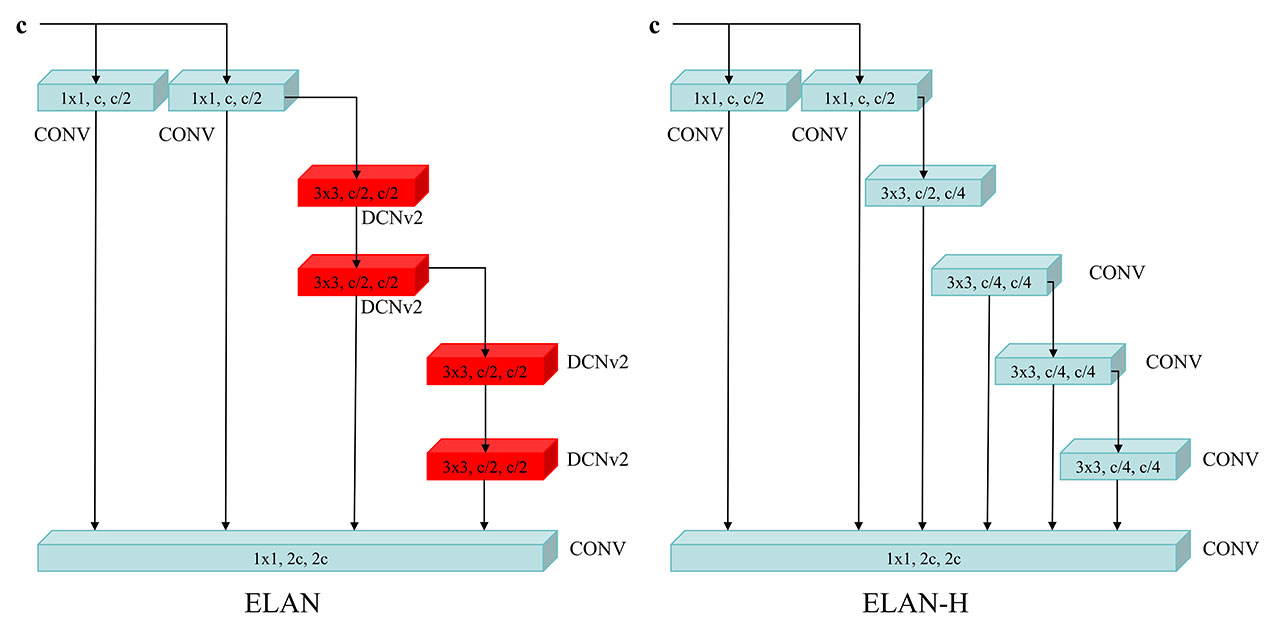
Since the picture will lose a lot of information during the feature extraction process, YOLOv7 integrated the Cross Stage Partial Darknet-53 (CSPDarknet-53) structure into the backbone network ELAN module of YOLOv7, as shown in Figure 2, to ensure that the network can extract features better. The CSPDarknet-53 architecture is an improvement to the classic Darknet-53 backbone network, introducing Cross-Stage Partial connections to allow interaction between bottom-level and top-level features to improve feature propagation and information mobility. The design of this architecture makes YOLOv7 perform well in multi-scale target detection tasks, and is suitable for object detection of various sizes and shapes. Furthermore, by performing detections on feature maps at different levels, the network can better adapt to various object sizes, improving the model’s performance while maintaining a relatively low parameter amount. We propose that the extended ELAN (ELAN-H) approach preserves the original architecture’s gradient transmission path entirely. Instead, it employs group convolution to augment the cardinality of the newly added features and amalgamates them from various groups using a shuffle and merge cardinality technique.
In order to better extract features and allow the network to learn deformed objects, we replaced all the convolutions with the original convolution kernel size 3 in the last two ELAN modules of the backbone network with DCNv2, which can be more adaptable Object deformation, and also solves the problem that when DCNv1 expands the area of interest, irrelevant areas affect the performance of the network. This targeted use of DCNv2 represents one of the core innovations of YOLOv7-bw, specifically designed to improve dense and small target detection performance. In general, today’s ELAN backbone network is more adaptable to targets of different sizes and deformations, and has more powerful feature extraction capabilities. Compared with ELAN module, in ELAN-H module of the detection head network, we chose to maintain the original YOLOv7 design and did not replace the convolution with DCNv2, the structure of ELAN and ELAN-H is shown in Figure 2.
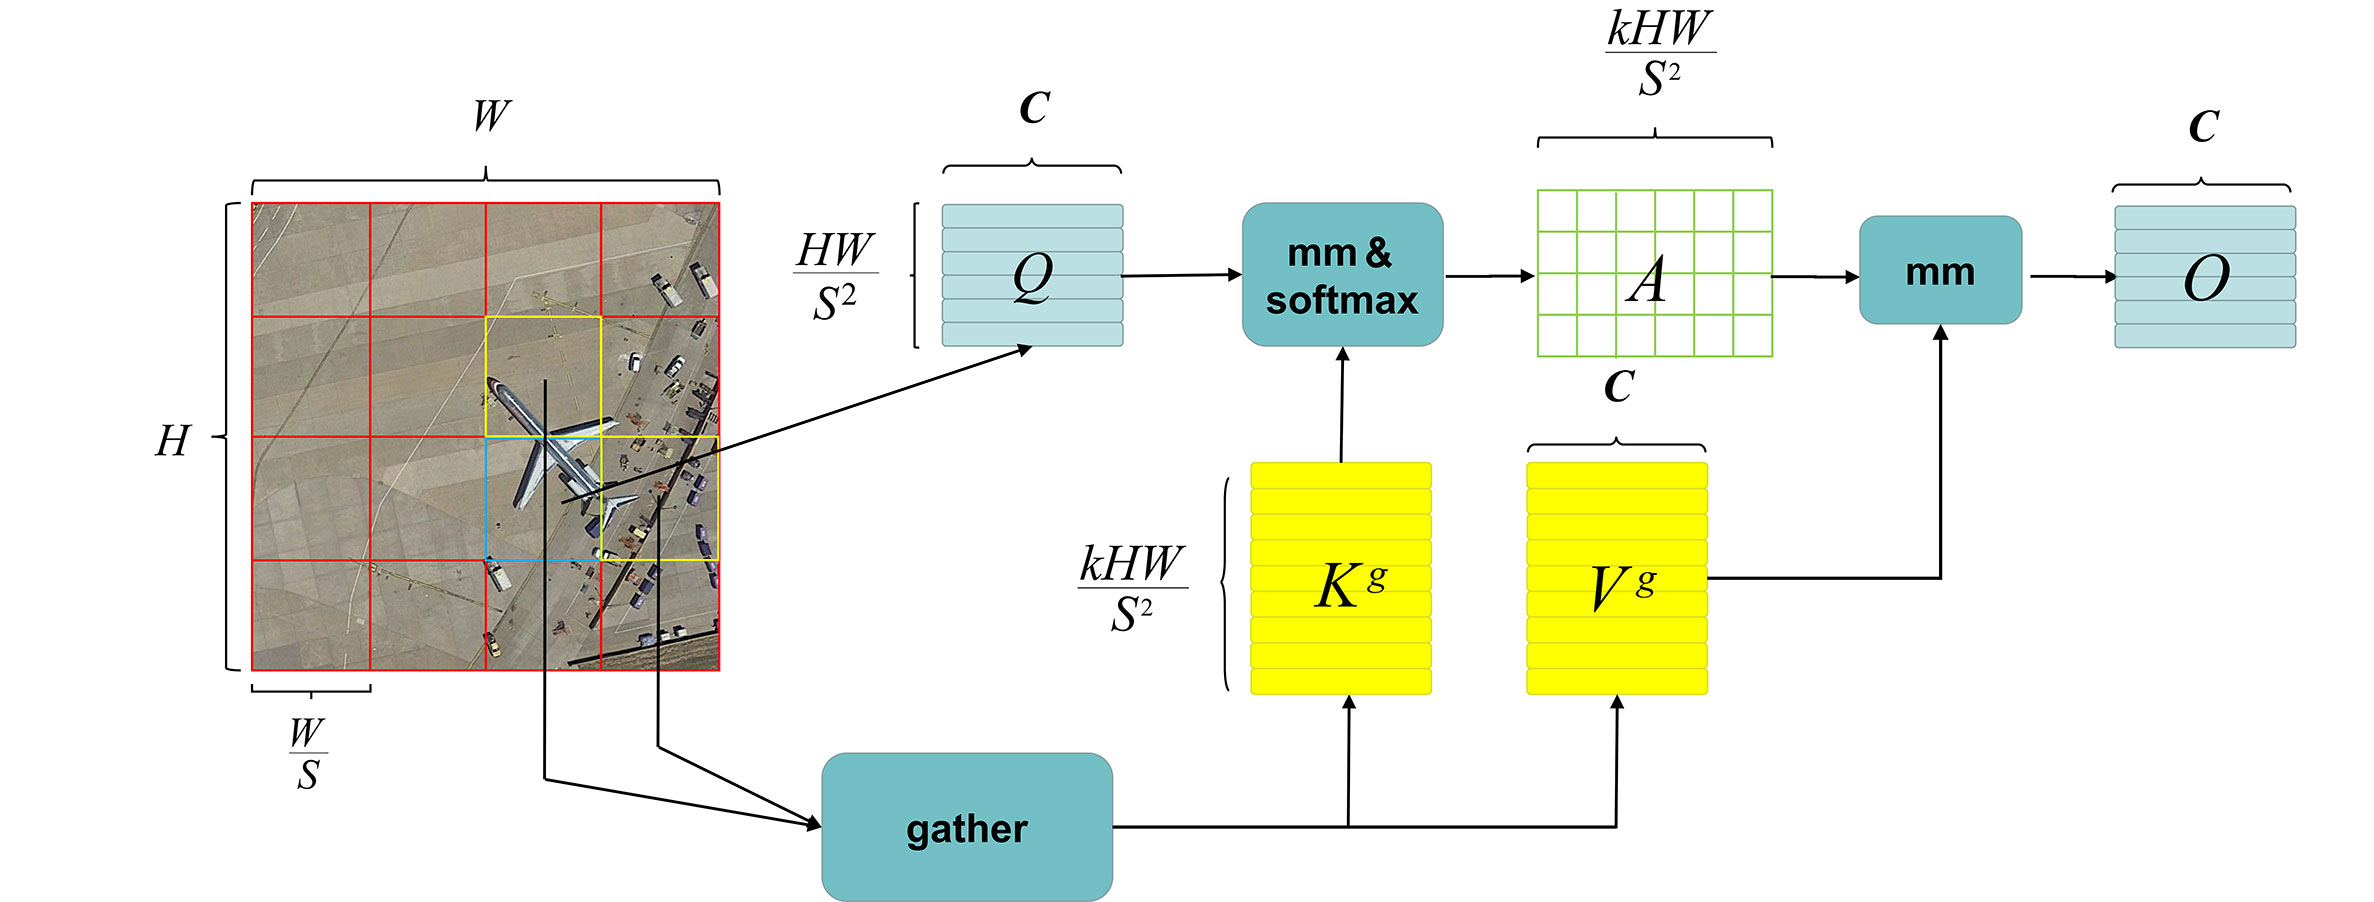
The primary objective of the self-attention mechanism is to enhance the network’s concentration on pivotal areas. Several self-attention modules mentioned earlier incorporate predetermined sparse patterns, which are manually crafted. Nevertheless, although different strategies are employed to merge or select key and value tokens, these tokens remain query-independent, meaning they are shared among all queries. However, queries associated with distinct semantic domains prefer different key-value pairs. Therefore, enforcing the same set of tokens for all queries may not be optimal. In contrast to other attention modules, BRA (Query-Aware Sparse Attention) represents a dynamic attention mechanism. Its objective is to empower each query to concentrate on a specific subset of the most semantically relevant key-value pairs. The core concept of BRA involves an initial filtration process at the regional level to eliminate the least relevant key-value pairs, thus preserving only a limited number of routing regions. Subsequently, fine-grained label-to-label attention is employed on the combination of these routing regions. By solely involving dense matrix multiplication, BRA performs satisfactorily while ensuring high computational efficiency. The specific steps can be roughly divided into the following three parts:
(1) Region division and input projection
Input a two-dimensional feature map, . First, it is divided into non-overlapping regions, where each region contains feature vectors, reshape X to . Then we derive query Q, key K, value V, so the linear projection is:
where , are the projection weights of query, key, and value, respectively.
(2) Area-to-area directed graph routing
Based on the first step, we find the engagement relationship by constructing a directed graph. First by applying the mean of each region to Q and K separately, get , then calculating the adjacency matrix of the interregional correlation of and :
The adjacency matrix measures the degree of semantic correlation between two regions. Next, only the top k connections of each region are kept to prune the correlation graph. Specifically, the routing index matrix is used to save the indexes of the top k connections row by row:
where the -th row of matrix comprises the indices representing the top k most pertinent regions related to the i-th region.
(3) Token-to-token attention mechanism
We can implement fine-grained label attention using the region-to-region routing index matrix denoted as. Each query token within region i examines all key-value pairs situated in the collective set of k routing regions. The initial step entails the collection of the key and value tensors:
where and are the tensors of the aggregated key and value, and then use the attention operation on the aggregated key-value pairs:
A context enhancement term is introduced here, the function is parameterized with depth-wise separable convolution. Furthermore, we configured the convolution kernel size to be 5.
The BRA algorithm generally leverages sparsity to bypass the computation of the least significant areas by gathering key-value pairs within the top k pertinent windows. This approach exclusively utilizes GPU-compatible dense matrix multiplication, as depicted in Figure 3, where mm represents matrix multiplication.
The BRA module is incorporated into the YOLOv7 network. Initially, it directs the feature map obtained from region extraction to its respective regions and employs token-to-token attention to obtain a novel output feature map. Given that this operation involves the feature graph, and since the Spatial Pooling Pyramid (SPP) is designed to mitigate image distortion resulting from image processing and repeated feature extraction, it is determined to insert the BRA module after the SPP stage. The BRA module, as one of YOLOv7-bw’s primary innovations, significantly enhances the network’s capability to detect dense small targets by adaptively emphasizing relevant spatial features.
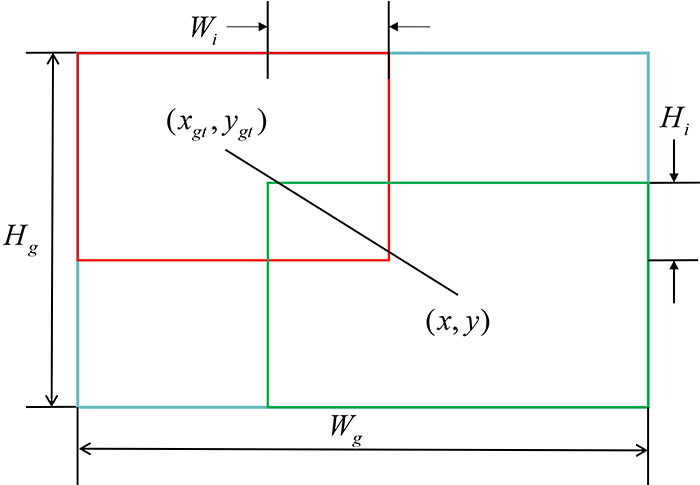
The loss function used in YOLOv7 for bounding box regression is CIoU [54], which increases the consideration of aspect ratio consistency based on the normalized length of the center point connection. However, it solves the problem that the anchor box cannot be optimized when the negative gradient and offset. However, it is inevitable that numerous inferior anchor boxes will be produced while making predictions, thus incorporating geometric indicators like aspect ratio or distance will exacerbate the punishment for subpar anchor boxes, consequently diminishing the model’s capacity to generalize. An ideal loss function ought to diminish the impact of geometric metrics when the anchor box aligns closely with the target box, without excessively intervening in the training process. Here, the distance attention is constructed with the distance metric, breaking through previous BBR losses which that relied on additive losses, and the two are multiplied to obtain WIoUv1 with a two-layer attention mechanism:
where will significantly scale up the LIoU of normal quality anchor boxes, will significantly reduce the RWIoU of high-quality anchor boxes. In order to prevent RWIoU from producing gradients that hinder convergence, Wg, Hg are separated from the computational graph in Figure 4 (superscript * indicates this operation).
Although WIoUv1 can be applied to various scenarios, it doesn’t effectively address the issue of blurred targets in remote sensing images. To enhance our focus on blurred targets, we adopt WIoUv3, which includes a focusing mechanism by incorporating a gradient gain calculation method (focus coefficient) based on v1. We replace the CIoU loss function in YOLOv7 with WIoUv3 to better handle the detection of blurred targets in remote sensing images. WIoUv3 defines the outlier to describe the quality of the anchor box, which is specifically defined as:
where represents the exponential running average with a momentum parameter m. Small outlier indicate high-quality anchor boxes and are assigned a low gradient gain. Similarly, anchor boxes with significant outliers also receive a low gradient gain, which effectively prevents low-quality examples from generating large, detrimental gradients. This approach ultimately directs the bounding box regression to prioritize anchor boxes of normal quality. A non-monotonic focusing factor is constructed using and applied to WIoUv1:
where denotes the gradient gain, and refer to the artificially set hyperparameters, because r is dynamic, the criteria for dividing the anchor box mass are also dynamic in WIoUv3. This dynamic approach allows WIoUv3 to adapt its gradient gain allocation strategy to best suit the current situation at any given moment.
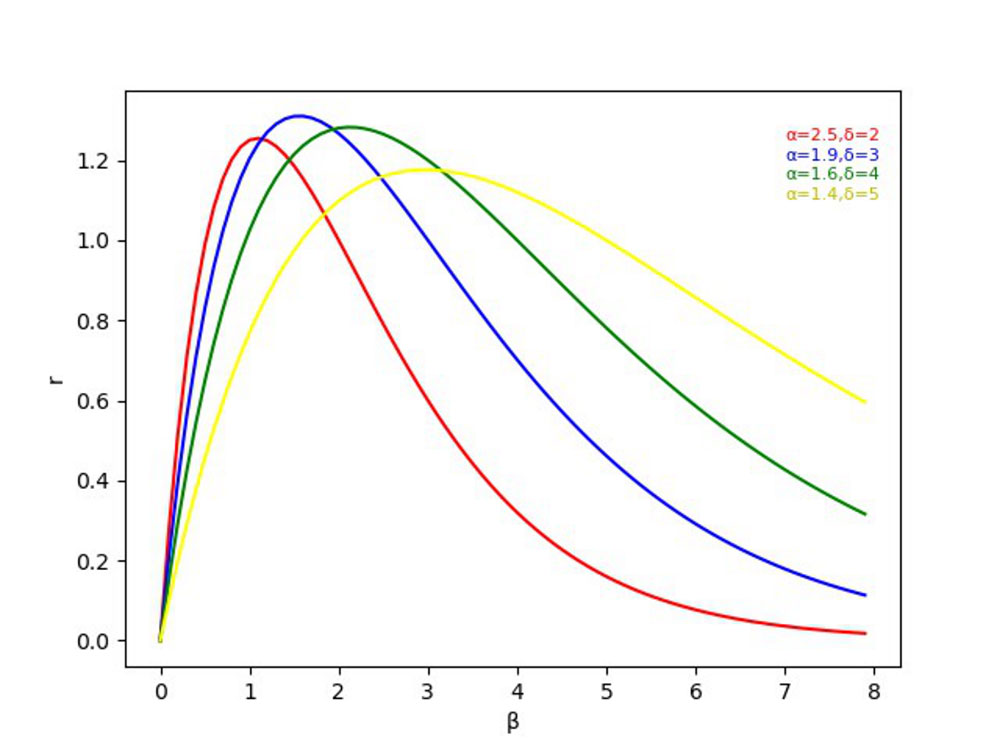
After we plot the influence of several different groups of and on the outlier and gradient gain r, as shown in Figure 5, the larger is, the further to the left the peak of the curve is and the smoother the curve is; the larger is, the larger the peak of the wave is. The highest gradient gain for detectors with good performance should be more appropriate when the outlier degree is between 1 and 2. On the contrary, when applied to detectors with poor performance, more attention should be paid to the better anchor boxes of the fit, that is, the highest gradient gain should be when outliers are low. As for a detector like YOLOv7, which has a good detection rate, we hope to have the highest gradient gain r when the outlier is between 1 and 2, and, at the same time, have a lower gradient gain when the outlier is high. It can be seen that the blue curve has better performance in the low and high outlier. There is a small gradient gain at all times, so the loss function pays more attention to the anchor boxes of ordinary quality, and we finally select hyperparameters =1.9 and =3 to apply to the final experiment (the experiment of hyperparameter determination is given in Section 3.2). Simultaneously, to avoid retaining low-quality anchor boxes during early training, we set the initial value , so that when LIoU=1, it has the largest gradient gain. The adoption of WIoUv3 as a bounding box regression loss function represents another key innovation of YOLOv7-bw, effectively addressing localization inaccuracies for densely clustered and blurred targets in remote sensing imagery.
At the input of YOLOv7-bw, we used mosaic data enhancement, anchor frame adaptive calculation and image adaptive scaling to preprocess the input data. Remote sensing images mostly contain small targets, and usually the detection accuracy is much lower than that of large targets. Therefore, the mosaic data enhancement method was selected and 4 pictures were spliced by random scaling, cropping, and arrangement. This approach can greatly enrich the data set, especially random scaling, which adds many small targets, making the network more robust. At the same time, the data of 4 pictures is directly calculated, so the Mini-batch size does not need to be very large. A single GPU can achieve better results, thus reducing the need for GPU calculations.
What’s more, in order to predict anchor boxes more accurate, the clustering method is used to adaptively calculate the data in the training set to obtain a set of optimal anchor box values. This set of optimal anchor boxes is used for fine-tuning in subsequent training. It can better adapt to the size of the target in the data set and get better prediction results.
In order to make our YOLOv7-bw perform better on remote sensing image data sets, we made a series of settings for the network parameters. These include training for 300 epochs; the batchsize is set as 16; resizing the input image size to 640*640; initial learning rate 0.01; final learning rate 0.1, etc.
In order to validate the integrity of the model, we utilized various evaluation metrics, including TP (True Positive), TN (True Negative), FP (False Positive), FN (False Negative), Precision, Recall, AP (Average Precision), precision-recall (P-R) curve, and mAP (mean Average Precision). These indicators provide insights into the relationship between the sample’s category and the model’s predicted results:
The precision is the percentage of the predicted true positive samples in the entire predicted positive samples, and the calculation result is:
where is the percentage of the predicted true positive samples in the entirely true positive sample, and the calculation result is:
where P-R curve illustrates the correlation between precision and recall. By plotting recall on the x-axis and precision on the y-axis, a specific curve corresponding to a particular category can be generated. Furthermore, the enclosed area of this curve represents the average precision (AP) value for that category.
Moreover, the mAP indicator serves as a comprehensive evaluation metric for target detection algorithms applied to a specific dataset. It entails calculating the average of AP values across all categories. Currently, mAP stands as the paramount indicator for assessing model performance, and it can be mathematically expressed as:
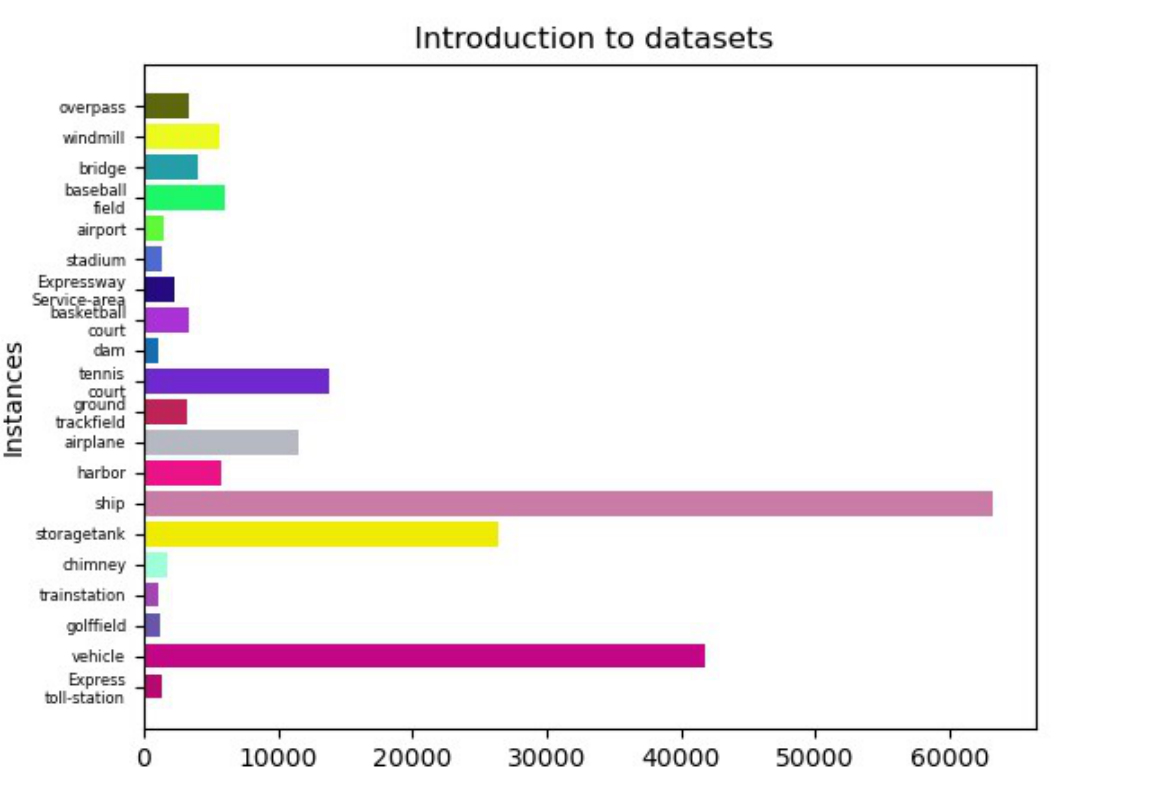
A series of comparative experiments were conducted to verify the effect of the improved YOLOv7 in this paper. The DIOR remote sensing image dataset was used, meticulously gathered by proficient individuals in the realm of Earth observation interpretation. This dataset encompasses 23,463 remote sensing images, comprising 190,288 manually annotated object instances. The dimensions of the images in the Dataset are 800×800 pixels, with a spatial resolution ranging from 0.5m to 30m. These instances are delineated by meticulously positioned bounding boxes across 20 prevalent object categories. The categories in datasets encompass airplanes, airports, baseball fields, basketball courts, bridges, chimneys, dams, highway service areas, highway tollbooths, ports, golf courses, ground track fields, overpasses, ships, stadiums, storage tanks, tennis courts, train stations, vehicles, windmills. The corresponding count for each category is presented in the Figure 6. It can be seen that there are a large number of vehicles and ships in the dataset but a small number of train stations and express-toll stations. The detection effect trained by such a dataset consistent with the actual number of objects in real life is more helpful for real-world tasks.
For the experiments stage, we have constructed a cutting-edge deep learning model using the widely adopted deep learning compiling framework of Pytorch. All our experiments were conducted on a high-performance workstation equipped with an Intel Xeon E5-2643 v3 CPU and eight Nvidia Tesla P40 graphics cards, each with 24GB of memory. For the training phase, we utilized the YOLOv7 model as a foundation. Throughout the process, we conducted 300 training rounds, with a batch size of 16.
The commonly used algorithms in the field of target detection are selected for comparison with the improvements in this paper, including classic algorithms such as Faster R-CNN[22], SSD[29], RetinaNet[55], and CornerNet[56]. At the same time, a series of YOLO methods are also selected to verify the comparison model. All comparative methods were carried out under similar pre-training and testing conditions. The object identification results of different types and the whole in the database are shown in Table 1. Among them, the first row of the table represents the detection algorithm used, the first column represents different categories, and the numerical result is the AP for this category.
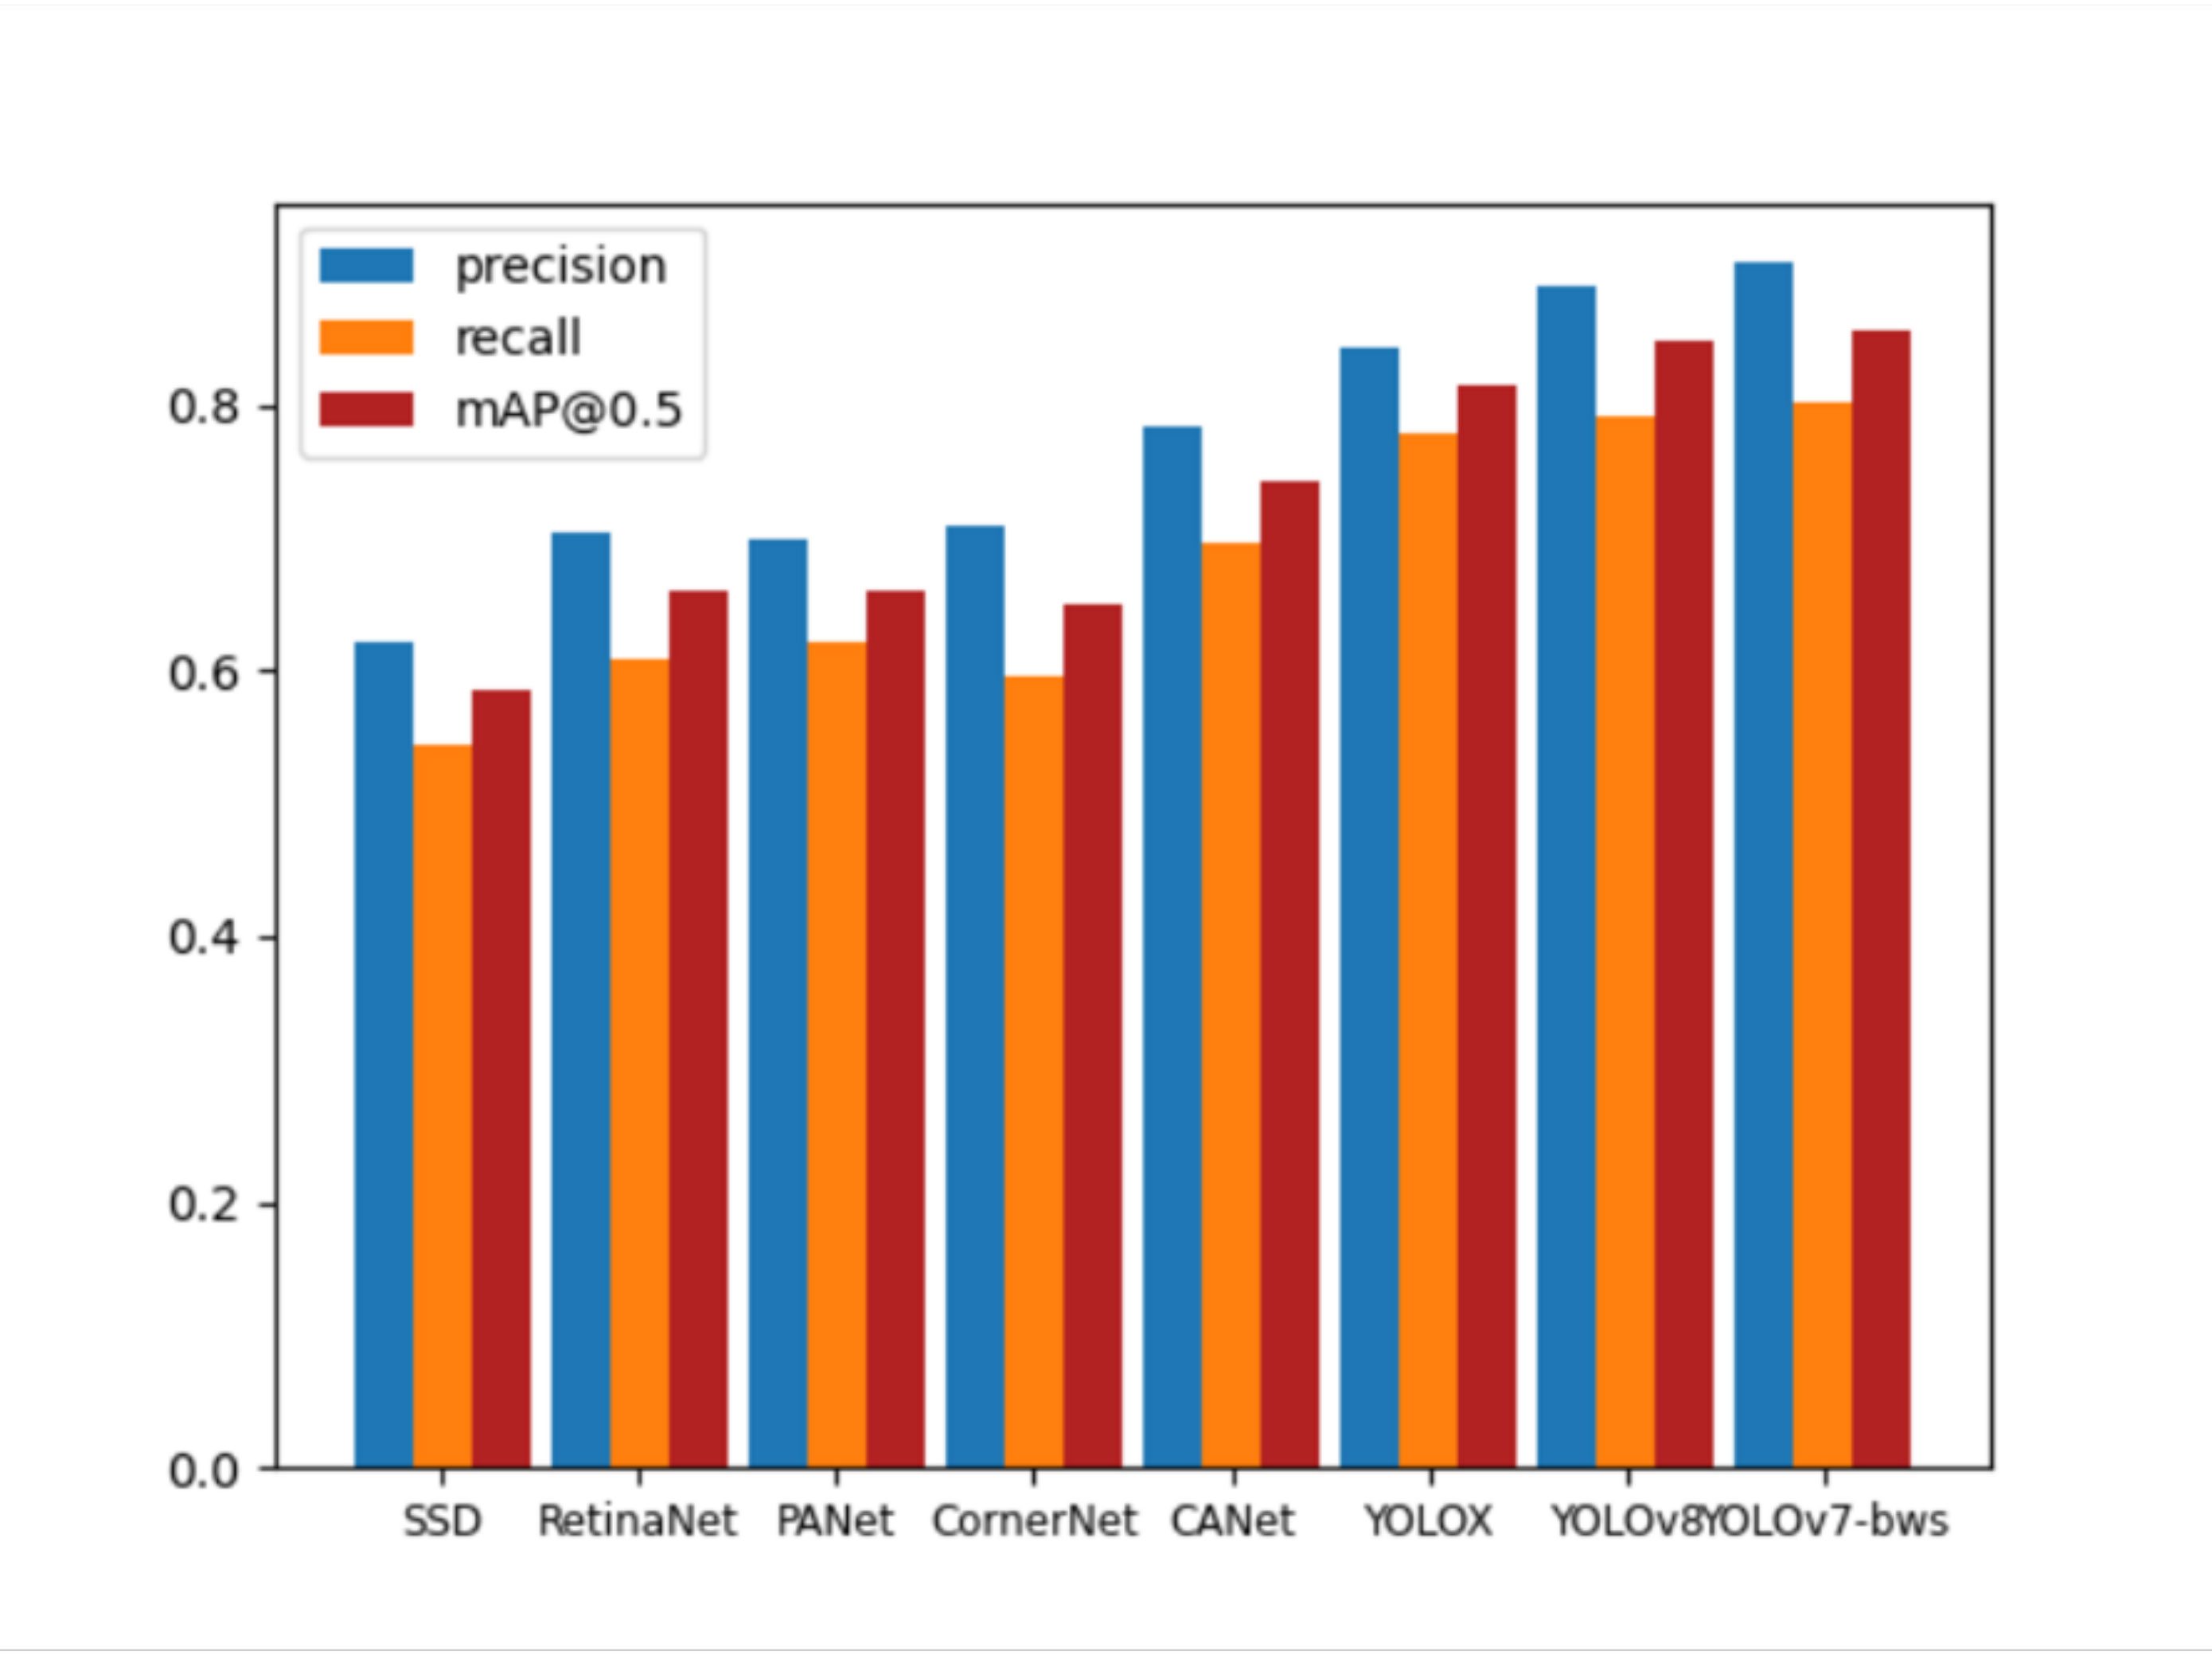
The last row is the average AP for all classes in the Dataset. Our YOLOv7-bw greatly improves vehicle and airplane compared with other algorithms. The reason is that vehicles and airplanes belong to the small target in remote sensing images, and vehicles are more likely to cluster and appear densely, which proves that YOLOv7-bw performs better on small and dense targets. For the target like the category of golffield, which belongs to the large target in the remote sensing image, although the improvement is not much, it has not decreased, which proves that our algorithm takes into account the large target at the same time, and has a certain degree of robustness. In addition to comparing the mAP of these classic algorithms, we also compared the precision and recall of our YOLOv7-bw with these algorithms, which obtain the highest precision and recall simultaneously, as shown in Figure 7.
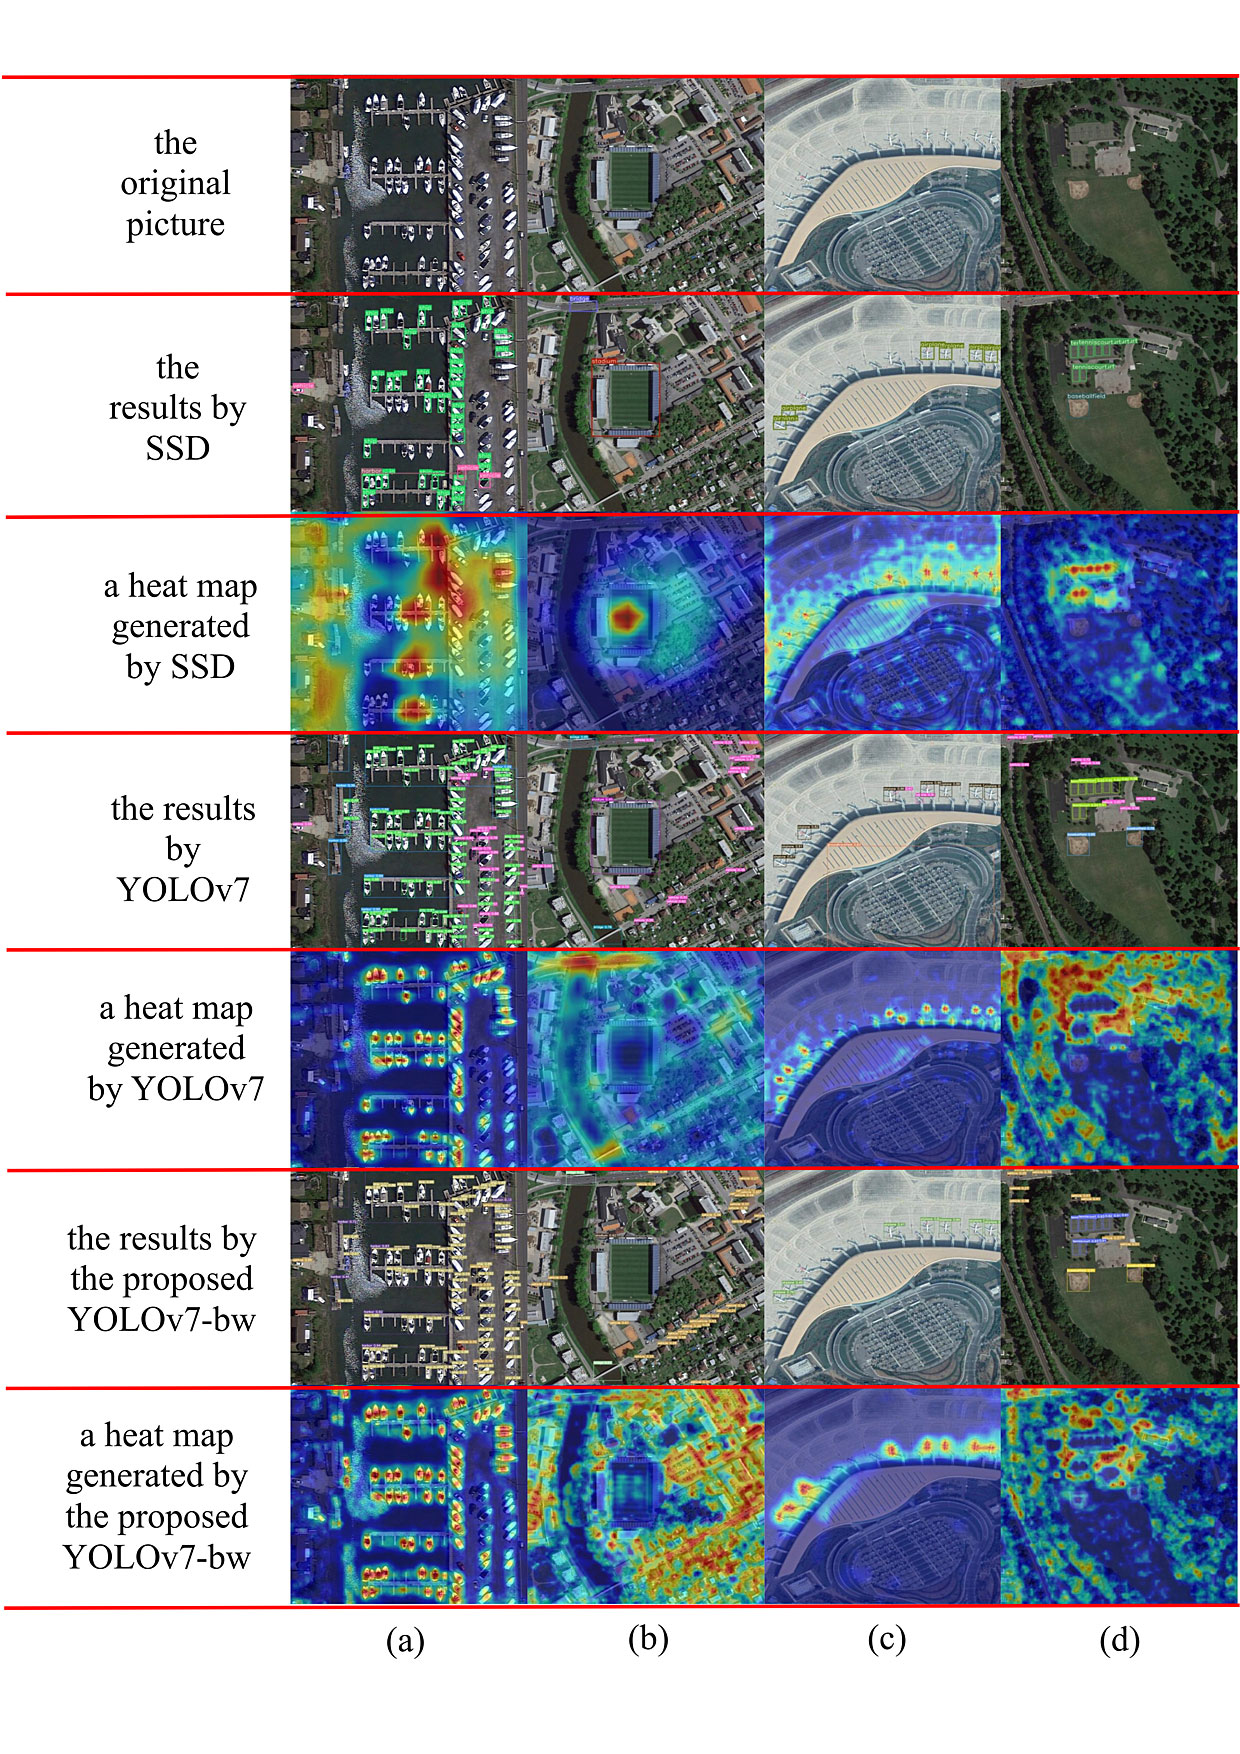
Finally, in evaluating the Dataset, we have carefully chosen a few images to compare the actual outcomes of the SSD, the YOLOv7 source code and our improved YOLOv7-bw version. The results of this comparison can be observed in Figure 8. The first image represents the original picture from the Dataset, followed by the SSD effect demonstration in the second image and the heat map generated by SSD in the third image, YOLOv7 effect demonstration and the heat map in the fourth and fifth image, our YOLOv7-bw effect demonstration and heat map in the sixth and final image.
Image (a) in Figure 8 shows that YOLOv7-bw produces fewer errors compared to YOLOv7 and More ships detected than SSD. In image (b), although YOLOv7-bw fails to detect several vehicles, which still surpass the SSD and 15 vehicles detected by YOLOv7. Moreover, the heat map indicates that YOLOv7-bw provides better accuracy and focus regarding vehicle positioning (the heat map generated by SSD and YOLOv7 can’t even locate the vehicle target). According to image (c), SSD only detected some airplane, although YOLOv7 detected more airplanes. Still, there were some false detections, only YOLOv7-bw, more airplanes were detected and no false detections occurred. In image (d), The detection rate of YOLOv7-bw is much higher than that of SSD and YOLOv7, and the focus area of the heat map is more concentrated on the target to be detected. To quantitatively assess the heatmap attention distribution, we computed the Mean Attention Score (MAS) within ground-truth bounding boxes. The MAS for YOLOv7-bw reached 0.78, compared to 0.63 for YOLOv7 and 0.51 for SSD, demonstrating that our proposed method effectively enhances target-focused attention.
Overall, as evident in Table 1, it’s clear that the YOLOv7-bw algorithm we introduced achieves the highest mAP at an IoU threshold of 0.5. This indicates that the our YOLOv7-bw algorithm enhances the detection performance of remote sensing images, resulting in an overall improvement. The model becomes competitive, especially in optimizing the detection of small and densely packed targets, effectively meeting the requirements for real-world remote sensing image detection in food supply applications.
Additionally, we evaluated the inference speed of the proposed YOLOv7-bw model to verify its practical applicability. On the same hardware environment (Nvidia Tesla P40 GPU), YOLOv7-bw achieves an average inference time of 8.2 ms per image, corresponding to approximately 122 FPS, which demonstrates its capability for real-time deployment. Despite the introduction of BRA and DCNv2 modules, the model maintains competitive computational efficiency compared to the baseline YOLOv7.
The experimental results show that YOLOv7-bw performs well in terms of both detection accuracy and speed. To evaluate for overfitting, we compared the performance of the model on the training and validation sets. The results showed that the performance gap between the training and validation sets was minimal, indicating that overfitting was not a concern. Regularization techniques such as L2 regularization and Dropout, as well as data augmentation, contributed to this result by ensuring the model generalizes well to new data.
To assess the best hyperparameters for implementing WIoUv3, we conducted a comprehensive set of experiments using the PyTorch framework. From the extensive categories available in the MS-COCO Dataset, we carefully chose 20 categories and used 28,000 images for training and 1,200 images for validation. For the model architecture, we selected the YOLOv7. During the training phase, our models underwent rigorous training for 120 epochs, utilizing a batch size of 32, and we applied different versions of the BBR loss function. The experimental results are eloquently presented in Table 2. Among them, mAP(50), mAP(75), and mAP(95) respectively represent the values of the map obtained when the IOU value is greater than 0.5, 0.75, and 0.95 in all categories.
| Categories | Faster R-CNN[22] | SSD[29] | RetinaNet[55] | PANet[57] | CornerNet[56] | CANet[58] | YOLOX[27] | YOLOv7[28] | YOLOv7-bw (ours) |
| Express-toll-station | 55.2 | 53.1 | 62.8 | 66.7 | 76.3 | 77.2 | 85.6 | 84.3 | 82.2 |
| Vehicle | 23.6 | 27.4 | 44.4 | 47.2 | 43.0 | 51.2 | 62.0 | 78.8 | 85.4 |
| Golffield | 68.0 | 65.3 | 78.6 | 72.0 | 79.5 | 77.3 | 82.6 | 82.8 | 83.3 |
| Trainstation | 38.6 | 55.1 | 55.2 | 57.0 | 57.1 | 67.6 | 71.5 | 70.8 | 68.3 |
| Chimney | 70.9 | 65.8 | 73.2 | 72.3 | 75.3 | 79.9 | 81.6 | 92.3 | 94.7 |
| Storagetank | 39.8 | 46.6 | 45.8 | 62.0 | 45.2 | 70.8 | 79.2 | 87.9 | 88.4 |
| Ship | 27.7 | 59.2 | 71.1 | 71.7 | 37.6 | 81.0 | 91.0 | 93.6 | 95.7 |
| Harbor | 50.2 | 49.4 | 49.9 | 45.3 | 26.1 | 56.0 | 67.9 | 64.8 | 74.0 |
| Airplane | 53.6 | 59.5 | 53.3 | 60.2 | 58.8 | 70.3 | 88.9 | 91.6 | 95.3 |
| Groundtrack field | 56.9 | 68.6 | 76.6 | 73.4 | 79.5 | 83.6 | 87.1 | 90.2 | 89.9 |
| Expressway-Service-area | 69.0 | 63.5 | 78.6 | 72.1 | 81.6 | 83.5 | 93.5 | 85.7 | 84.5 |
| Dam | 62.3 | 56.6 | 62.4 | 61.4 | 64.3 | 67.7 | 76.6 | 78.3 | 80.7 |
| Basketball court | 66.2 | 75.7 | 85.0 | 80.5 | 80.8 | 87.8 | 92.1 | 89.6 | 88.5 |
| Tenniscourt | 75.2 | 76.3 | 81.3 | 80.9 | 84.0 | 88.2 | 92.3 | 90.4 | 96.1 |
| Stadium | 73.0 | 61.0 | 68.4 | 70.4 | 70.7 | 79.8 | 86.5 | 93.0 | 95.2 |
| Baseballfield | 78.8 | 72.4 | 69.3 | 70.6 | 72.0 | 72.0 | 86.7 | 94.1 | 96.7 |
| Windmill | 45.4 | 65.7 | 85.5 | 84.5 | 75.9 | 89.6 | 92.8 | 84.9 | 84.1 |
| Bridge | 28.0 | 29.7 | 44.1 | 43.6 | 46.4 | 55.7 | 55.8 | 55.6 | 64.1 |
| Airport | 49.3 | 72.7 | 77.0 | 72.0 | 84.2 | 82.4 | 89.1 | 88.9 | 89.8 |
| Overpass | 50.1 | 48.1 | 59.6 | 56.9 | 60.6 | 63.6 | 67.2 | 76.4 | 75.8 |
| [email protected] | 54.1 | 58.6 | 66.1 | 66.1 | 64.9 | 74.3 | 81.5 | 83.7 | 85.6 |
According to the data presented in Table 2, it is evident that the effectiveness of WIoUv3, incorporating dynamic non-monotonic focusing, surpasses that of WIoUv1, which solely employs a focusing mechanism. At the same time, when =1.9 and =3, WIoUv3 has the best performance under different IoU thresholds, which are 66.57, 57.03, and 49.81, respectively. Ultimately, we decided to use =1.9, =3 as the final hyperparameter setting to participate in the experiment after.
| mAP(50) | mAP(75) | mAP(95) | |
| WIoU v1 | 65.74 | 55.92 | 48.88 |
| WIoU v3 | |||
| ( = 1.4, = 5) | 66.09 | 56.54 | 49.30 |
| WIoU v3 | |||
| ( = 1.6, = 4) | 66.26 | 56.82 | 49.62 |
| WIoU v3 | |||
| ( = 1.9, = 3) | 66.57 | 57.03 | 49.81 |
A series of ablation experiments were conducted to evaluate each module’s functionality within the model. The dataset selects the DIOR remote sensing dataset in Section 3.2 of the experiment, and performs training and testing under the same conditions. We utilized the YOLOv7 model as a foundation. In order to enhance the model’s performance, we introduced the BRA module (referred to as YOLOv7-b) and replaced the WIoUv3 loss function (referred to as YOLOv7-w). Additionally, we evaluated the combined effects of both modifications with our YOLOv7-bw variant, conducting ablation experiments accordingly.
The outcomes of these experiments are presented in Table 3, indicating that our YOLOv7-bw model achieved the most favorable results on the DIOR Dataset. Remarkably, it achieved a precision level of 85.63 when an IoU threshold of 0.5 was applied.
| Method | WIoU | BRA | [email protected] |
| YOLOv7 | 83.70 | ||
| YOLOv7-w | ✓ | 84.72 | |
| YOLOv7-b | ✓ | 84.25 | |
| YOLOv7-bw | ✓ | ✓ | 85.63 |
As shown in Table 4, we further conducted fine-grained ablation experiments on selected critical categories, including small dense targets (vehicles, ships, airplanes) and large targets (golffield, stadium). It can be observed that both WIoUv3 and BRA modules contribute positively across all categories. Specifically, the BRA module improves detection accuracy for small dense targets like vehicles and ships by better focusing attention on dense regions. Meanwhile, the WIoUv3 loss enhances bounding box regression, leading to improved localization. The combined YOLOv7-bw achieves the highest performance, particularly notable on small targets, while maintaining competitive results on large objects. This clearly demonstrates that the strategic integration of BRA, WIoUv3, and DCNv2 collectively contributes to the significant performance gains observed, validating the effectiveness of our innovative design choices.
| Method | Vehicle | Ship | Airplane | Golffield | Stadium |
| YOLOv7 | 78.8 | 93.6 | 91.6 | 82.8 | 93.0 |
| YOLOv7-w | 81.3 | 94.4 | 92.7 | 83.0 | 93.1 |
| YOLOv7-b | 83.9 | 95.1 | 93.4 | 83.1 | 93.1 |
| YOLOv7-bw | 85.4 | 95.7 | 95.3 | 83.3 | 95.2 |
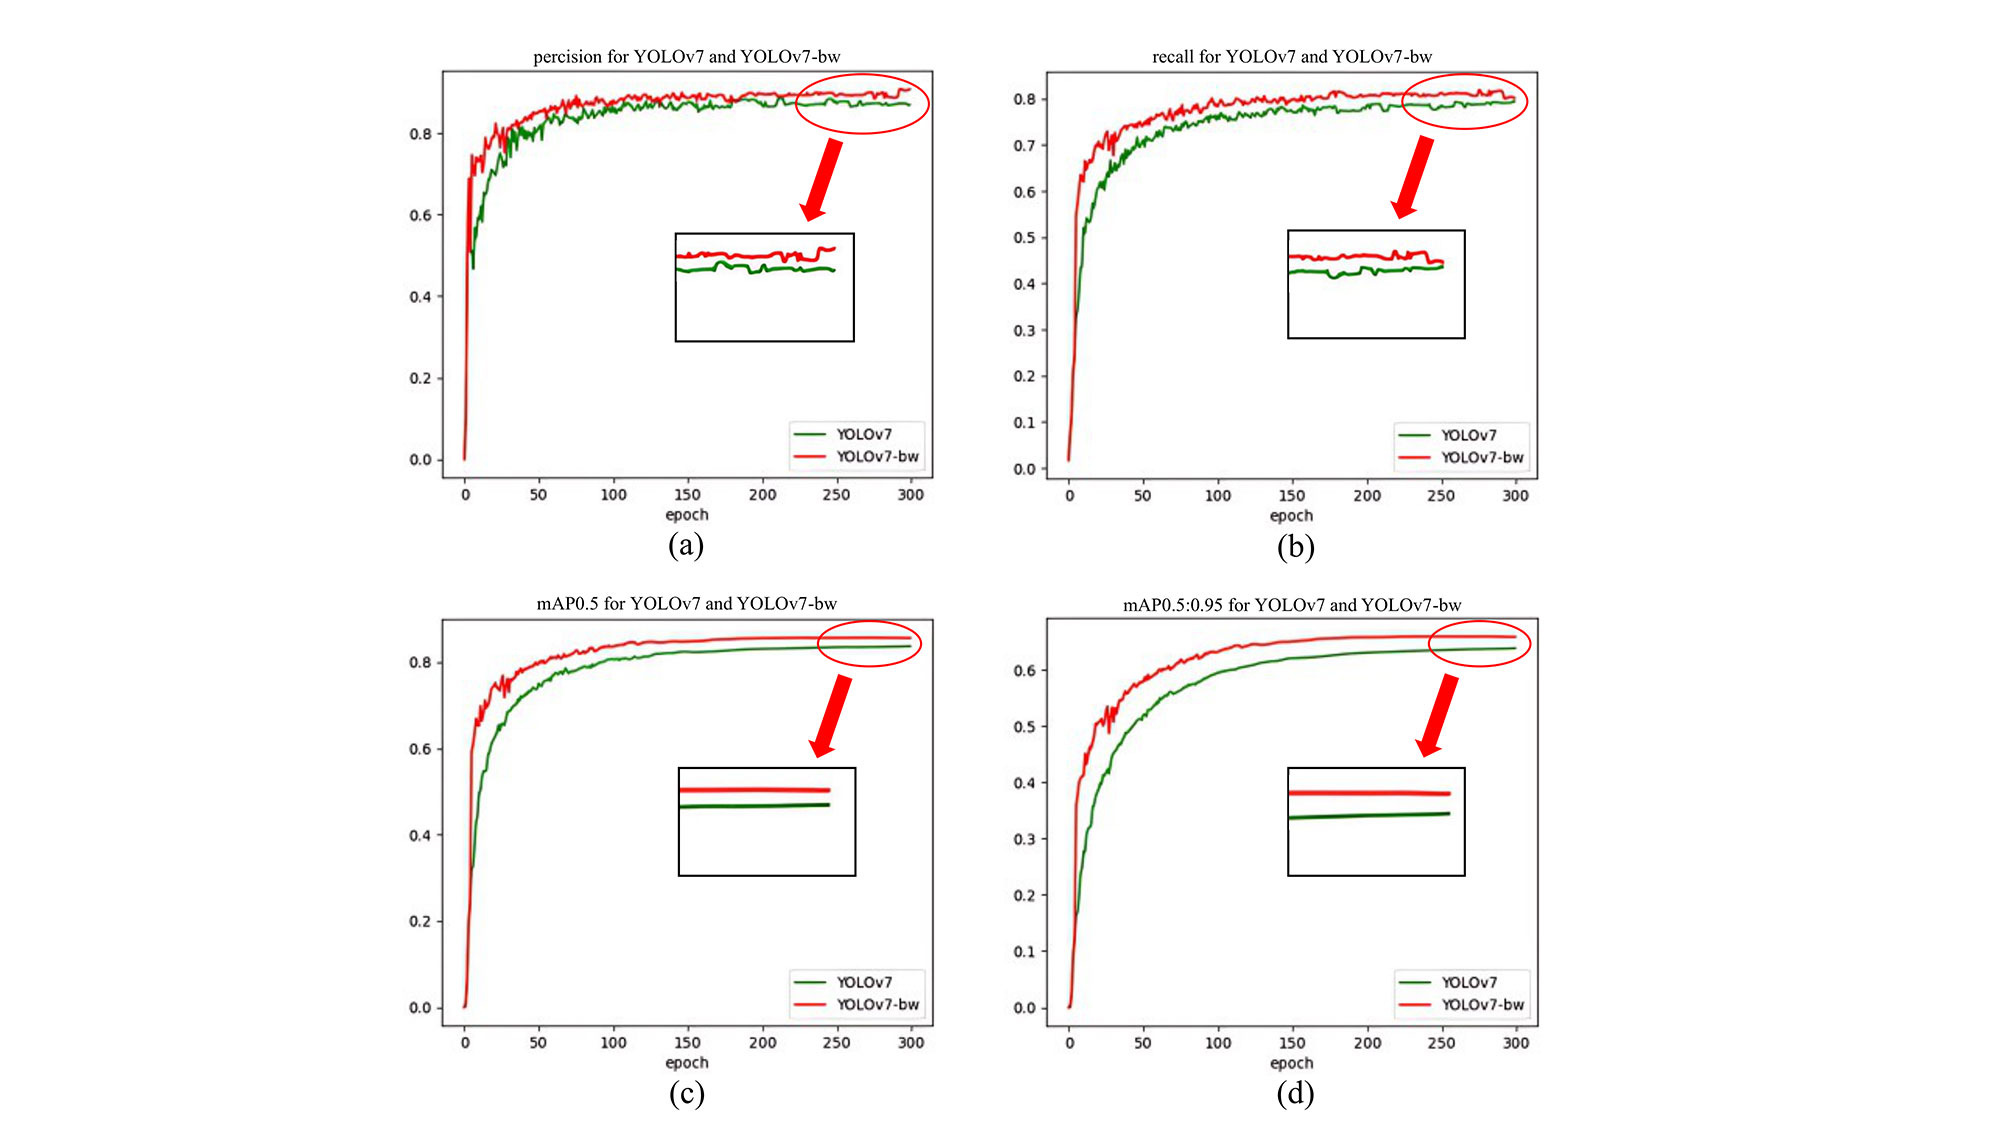
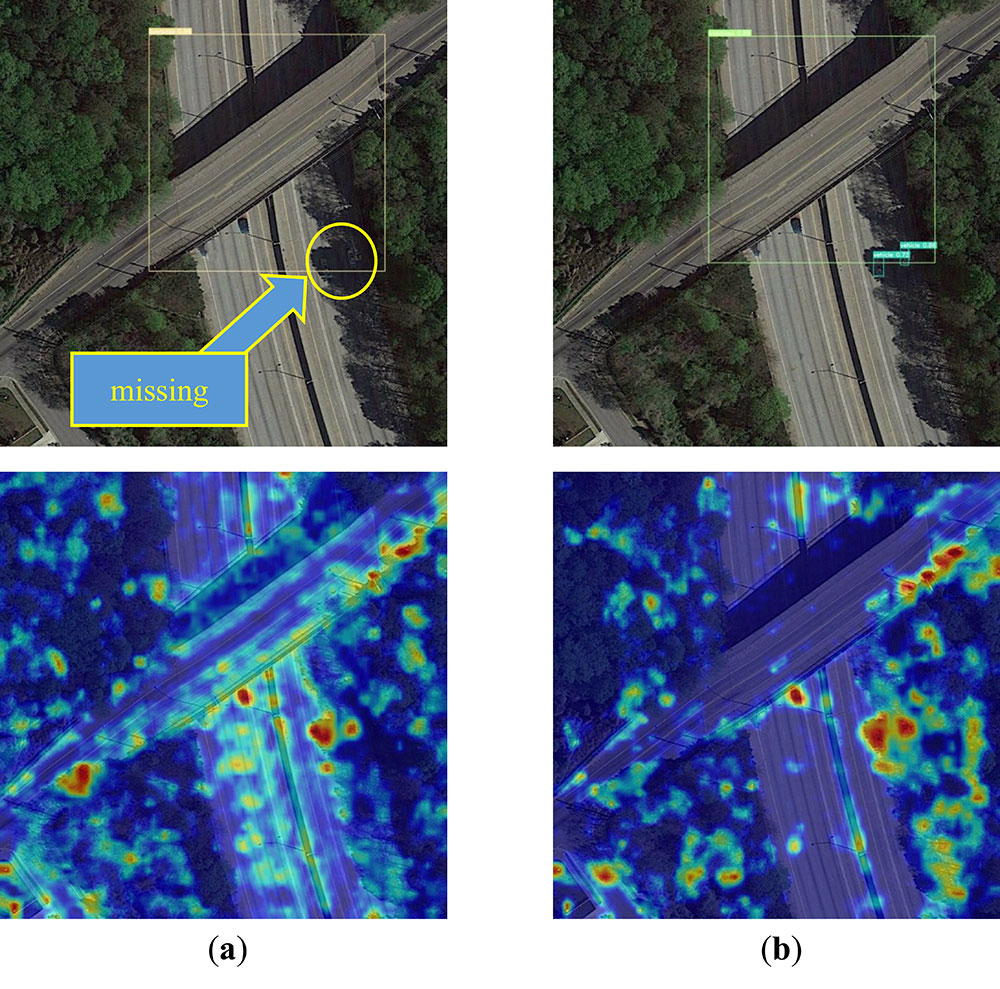
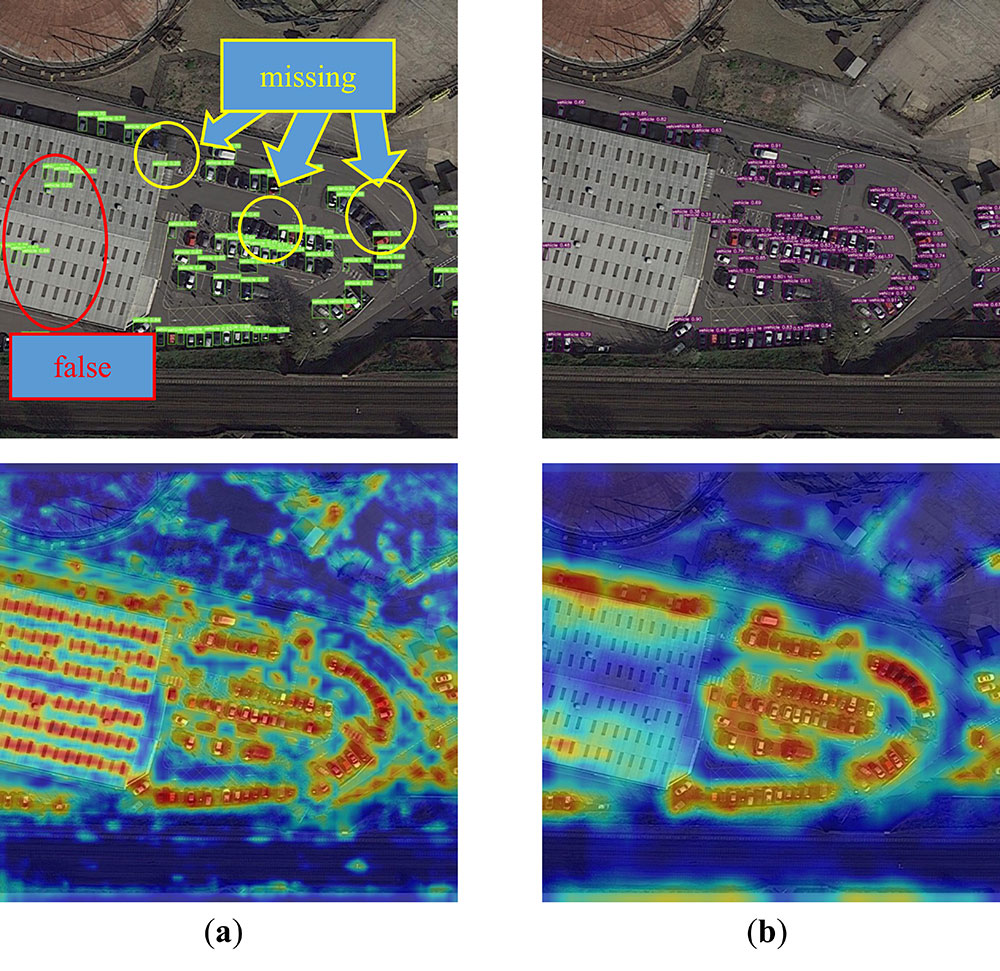
Simultaneously, we graphed the accuracy measurements of precision, recall, mAP@ 0.5, and [email protected]:0.95 for both YOLOv7-bw and the original YOLOV7 source code, as exemplified in Figure 9. Among them, Precision is how many of the detected categories are accurate, and Recall is how many of all accurate categories have been detected. Besides, [email protected] and [email protected]:0.95 refer to the average value of all categories of AP under different IOU thresholds, which is the most important indicator of detection accuracy. According to the data presented in Figure 9, we can see that our YOLOv7-bw has a faster convergence speed, and it is close to being stable at around 50 rounds. Furthermore, YOLOv7 achieved an overall yield of 86.93%, 79.38%, 83.70%, and 63.9% in its final iteration. Conversely, our YOLOv7-bw exhibited a superior performance with respective scores of 90.73%, 80.13%, 85.63%, and 65.93%. These results unequivocally establish that YOLOv7-bw surpasses YOLOv7 in precision, recall, [email protected], and [email protected]:0.95. The inherent features of the remote sensing image encompass the qualities of petite targets, particularly when frequently exposed to atmospheric conditions, resulting in targets being obscured in shadows, thereby significantly amplifying the challenge of detection. This drawback restricts its progress in the realm of food provision. Figure 10 provides a visual representation of this scenario. In (a), the outcomes of the YOLOv7 assessment are presented, wherein three vehicles went undetected. However, upon incorporating WIoUv3 to YOLOv7, despite the continued omission of one vehicle due to its distinct dynamic non-monotonic focal mechanism, it can be observed in (b) that both the confidence level of object detection and the blurriness within the shadow have been enhanced to a certain degree. Consequently, the detection capabilities for all diminutive targets have been improved. Moreover, the heat map generated by the model pays less attention to noise such as trees. To further quantify these observations, we computed MAS within ground-truth bounding boxes. The results show that YOLOv7-bw achieves an MAS of 0.74, compared to 0.59 for YOLOv7, indicating a more refined and concentrated attention mechanism that effectively suppresses background distractions while enhancing target detection. Another noteworthy characteristic of remote sensing images is the concentration of small targets in specific areas. The BRA module shifts its focus towards these regions, employing a precise attention mechanism that aligns with the unique attributes of remote sensing imagery. This reality is depicted in Figure 11. The left image (a) exemplifies the detection outcome achieved by running the original YOLOv7 source code, while the right image (b) showcases the detection outcome after integrating the BRA module into the original YOLOv7 source code. Adding the BRA module increases the number of cars detected in the dense cluster, reducing false identifications of chimneys on the roof as cars. Additionally, the heat map reveals that the model pays less attention to the chimneys on the roof after implementing the BRA module. A quantitative comparison further confirms this improvement—after incorporating the BRA module, MAS within target regions rose from 0.67 (YOLOv7) to 0.81 (YOLOv7-bw), indicating a more refined ability to concentrate on relevant objects while effectively filtering out background noise. Overall, with the inclusion of BRA and the replacement of WIoUv3, YOLOv7 has significantly improved its detection capabilities for small, indistinct and dense targets. This enhancement enables its more effective application in agricultural scenarios, thereby contributing to facilitating food supply.
Compared to conventional detectors such as Faster R-CNN and SSD, which primarily rely on fixed receptive fields and anchor-based mechanisms, YOLOv7-bw demonstrates superior performance in detecting small and densely packed targets. This improvement can be attributed to the integration of the Bi-level Routing Attention (BRA) module, which dynamically adjusts attention to dense object regions, unlike traditional static attention mechanisms. Additionally, the adoption of DCNv2 enables the network to adapt to object deformations and spatial variance, a limitation observed in earlier architectures like RetinaNet and standard YOLOv7. Moreover, by incorporating WIoUv3 as the loss function, YOLOv7-bw improves bounding box regression precision for small targets, addressing the localization issues prevalent in previous methods. These enhancements collectively result in better feature representation and localization accuracy, as evidenced by the higher mAP and recall values. Our results align with previous studies emphasizing the importance of attention mechanisms and deformable convolutions in complex scenarios, while our model further refines these strategies to suit remote sensing imagery.
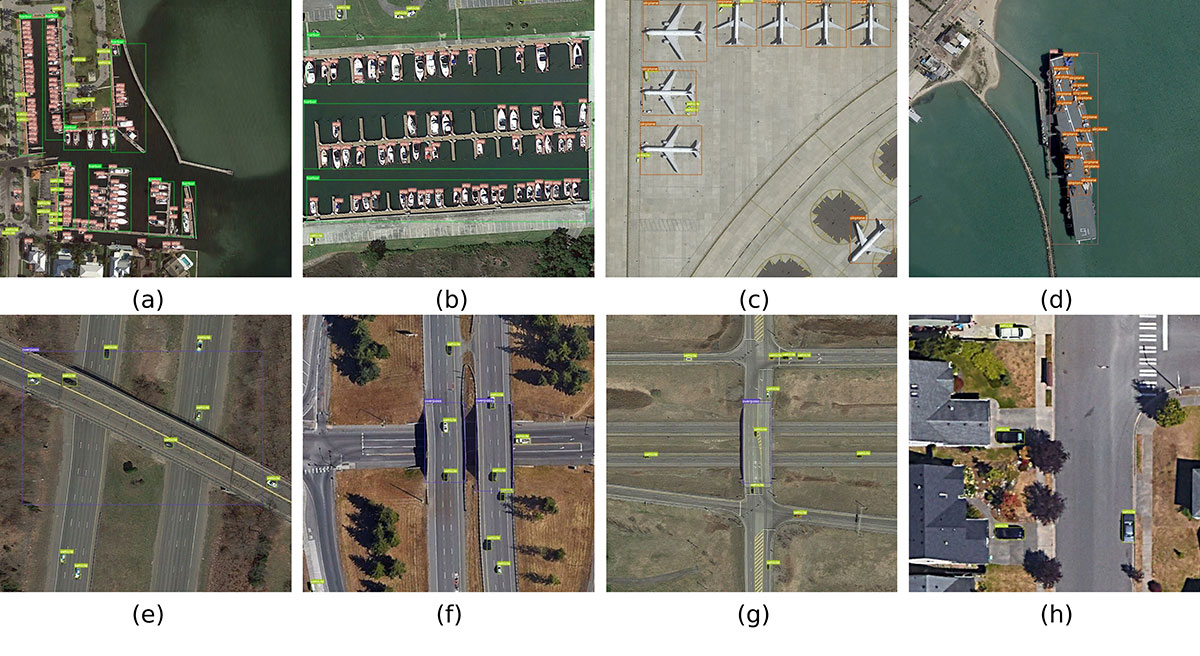
Remote sensing technology is widely applied across various fields in modern society, including monitoring transportation such as vehicles, ships, and airplanes. These monitoring activities contribute to traffic management and safety and provide robust support for optimizing food supply. Real-time monitoring of this transportation allows for a better understanding of road congestion, enabling the implementation of corresponding measures to improve traffic flow. This is crucial for the food supply chain as traffic congestion can lead to delays in food transportation, affecting the freshness and quality of food. On the other hand, by timely understanding the traffic situation, managers can more accurately predict the arrival time of food, thereby optimizing inventory management. This helps to prevent inventory backlog or shortages, increase inventory turnover, and reduce inventory costs. In the DIOR remote sensing image Dataset, the proportion of vehicles, ships, and airplanes exceeds 50% of the total, enhancing the detection accuracy for the DIOR Dataset, which is essentially an improvement in the efficiency of monitoring transportation. Simultaneously, the improved accuracy in detecting other categories in the Dataset further validates the robustness of our algorithm. Finally, to further demonstrate the critical role of our proposed method in food supply applications, we have selected 8 images for presentation, primarily focusing on vehicles. The actual results are shown in Figure 12. Our algorithm has detected almost all transportation in the picture, which plays a key role in logistics monitoring in food supply applications. However, there are still some small shortcomings. For example, in picture a, there is a missed detection of a vehicle, and in picture b, there is an incorrect detection of an airplane. In the next research, we will further solve these problems. We hope our algorithm can be further applied in the field of food supply.
Remote sensing imagery finds extensive application in military operations, agriculture, urban planning, environmental monitoring, and food supply. However, these images generally have small targets and densely distributed objects, which poses a huge challenge to traditional target detection. Missing and inaccurate detection of targets is common, hindering its application in the food supply. This article introduces an enhanced version of the YOLOv7 algorithm to solve the detection problem of small and dense targets in remote sensing images. It mainly targets the logistics monitoring link in food supply, making food supply more convenient through faster and more accurate detection of transportation.
The proposed detector incorporates a Bi-level Routing Attention module into the pooled pyramid SPPCSPC network of YOLOv7. This module amplifies attention towards areas of concentrated targets, thereby fortifying the network’s ability to extract features of dense small targets through effective feature fusion. Furthermore, the detector harnesses dynamic non-monotonic WIoUv3 to ensure a reasonable gradient gain allocation strategy at each moment, thus augmenting the network’s focus on target detection. Additionally, we substituted the convolution with a 3-dimensional convolution kernel in the ELAN module to DCNv2, augmenting the network’s aptitude for extracting features from targets of diverse shapes. Through comparative experiments utilizing the DIOR remote sensing image dataset, the proposed detector achieves higher [email protected] and [email protected]: 0.95, with detection rates of 85.63% and 65.93%, respectively. These results surpass the YOLOv7 detector by 1.93% and 2.03%. Furthermore, the proposed network models outperform frequently employed algorithms, affirming the efficacy of our proposed algorithm, which will be conducive to food supply applications. Compared to the latest models such as YOLOv8 and RT-DETR, YOLOv7-bw exhibits notably higher accuracy and inference speed, effectively addressing current limitations in dense small-target detection, and thereby demonstrating greater practical value for real-time remote sensing applications. Overall, the introduced innovative modules effectively address critical issues in dense small object detection, demonstrating practical and theoretical significance.
Future research will primarily explore integrating other attention mechanisms like self-attention and channel attention to further enhance the network’s capability to focus on vital features while refining detection for undetected small targets. Finally, we firmly believe that the enhanced algorithm expounded in this article can be further applied in real-world food supply applications.
 Copyright © 2025 by the Author(s). Published by Institute of Emerging and Computer Engineers. This article is an open access article distributed under the terms and conditions of the Creative Commons Attribution (CC BY) license (https://creativecommons.org/licenses/by/4.0/), which permits use, sharing, adaptation, distribution and reproduction in any medium or format, as long as you give appropriate credit to the original author(s) and the source, provide a link to the Creative Commons licence, and indicate if changes were made.
 Chinese Journal of Information Fusion
ISSN: 2998-3371 (Online) | ISSN: 2998-3363 (Print)
Email: [email protected]

Portico
All published articles are preserved here permanently:
https://www.portico.org/publishers/iece/